Download
1 / 26
270 likes | 460 Views
Introduction to Information Visualization. Slavomir Petrik, Vaclav Skala. Centre of Computer Graphics and Visualization University of West Bohemia Plzen, Czech Republic. 2007. History of visualization Scientific visualization vs. Information visualization

E N D
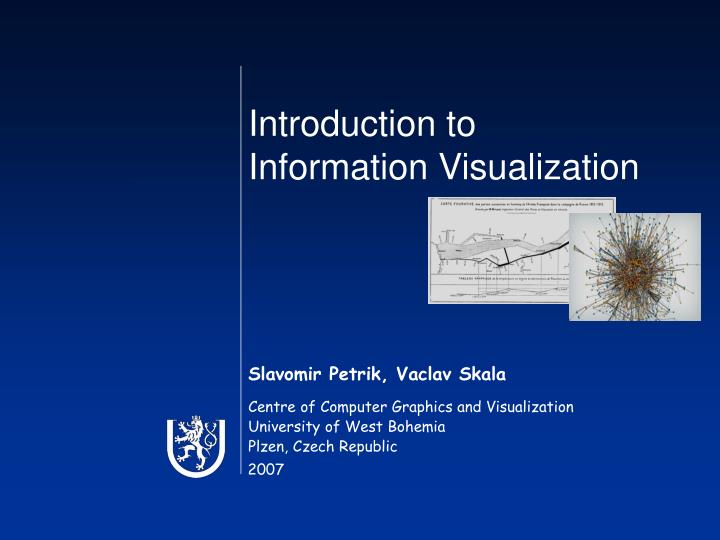
Introduction to Information Visualization Slavomir Petrik, Vaclav Skala Centre of Computer Graphics and Visualization University of West Bohemia Plzen, Czech Republic 2007
History of visualization • Scientific visualization vs. Information visualization • Concepts, directions and techniques of InfoVis • 1D, 2D, nD techniques • Tree and graph-based vis. • Network structure vis. • Visualization in InfoVis • Interacting with visualization Overview of the talk 2 / 25
World map with Babylon in its centre 2300 BC (British museum) Growing amount of information within a single image … From single sketch to tree maps 14th century Roman Britain 15th century Leonardo da Vinci 1864 Civil war Today… Network structure 3 / 25
Visualization of science vs. science of visualization Scientific visualization Direct visualization vs. visualization of structure Large data Science of visualization 01010101001000100011110010 01001 00100001111001000100 00100011 111001 1000100110 … . Information visualization 4 / 25
Still not defined precisely! • Scientific visualization • deals with direct visualization of data that have natural geometric • structure • Information visualization • deals with more abstract data represented by trees or graphs • Visual Analytics scientific investigation of the use of visualization in sense-making and reasoning Areas of interest 5 / 25
Examples Napoleon march into Russia Charles Minard, 1861 Ptolemy world map, 150 AD Information visualization Basic concept Information visualization Visualization Data description by structures Data acquisition Preprocessing enrichment, transformation Highlight selected information 6 / 25
1D, 2D techniques • High dimensional data • Tree-based techniques • Network visualization • Documents visualization Visualization Importance of colors Focus + context Information visualization II. Interaction with visualization 7 / 25
Linear traverse of data Table Lens Rao, 1994 ( Multivariate data ) Scatterplot Klein, 2002 ( Span Space ) LensBar ( InfoVis 1998 ) 1D techniques FacetMaps ( InfoVis 2006 ) 8 / 25
Fit the 2nd dimension data to the first one, GIS applications Large datasets Healey, 1999 Enridged contour maps van Wijk, Telea, Vis 2001 2D techniques World mapper InfoVis 2006 9 / 25
2D restriction of screen • Multiple views and projections Scatterplot matrix Cleveland, 1985 Parallel coordinates Inselberg, 1990 … generalization: Moustafa, Wegman, 2002 nD techniques Dimensional stacking Langton et al. 2007 10 / 25
with help of user interaction World within worlds Feiner, 1990 Hypercell Santos, 2002 nD techniques II. Interactive scatterplots Kosara, 2004 11 / 25
multiple views and projections for dimensionality reduction Perspective wall Mackinlay et al. 1991 Prosection views Furnas, 1994 nD techniques III. Sunflower Rose, 1999 12 / 25
data organized and explored via tree structure • two different views of a tree • Side view • Top view Tree-based techniques 13 / 25
various forms of side view • combined with user interaction to choose proper view Cone tree Robertson et al., 1991 ... generalized by Jeong & Pang, 1998 Tree-based techniques(side view) Cylindrical tree Dachselt, Ebert, 2001 14 / 25
space filling problem Tree map Shneiderman, 1992 Recent surveys on Tree maps: http://www.cs.umd.edu/hcil/treemap-history/index.shtml http://www.cse.ohio-state.edu/~kerwin/treemap-survey.html 800 files on disk Tree-based techniques(top view) Cushion tree map Wijk, 1999 Ordered and quantum tree map Bederson, 2002 15 / 25
Bar tree + Arc diagram Analysis of state transition graphs Pretorius, TVCG 2006 Tree-based techniques(top view) 16 / 25
intended to visualize a structure of computer network • a lot of items that need to be shown in a meaningful way • closely related to graph drawing problem H3 Directed graph in 3D hyperbolic space Munzer, obertson et al., 1991 ( video H3 ) Visualizing network structure MBone Munzer, 1996 Radial layout Yee, 2001 Edge bundles Holten, 2006 Topographic vis. Cortese, 2006 17 / 25
“So much has already been written about everything that can’t find out anything about it.” - James Thurber ( 1961 ) • Document visualization is not information retrieval • Vast document storage: www, digital libraries (structured vs. unstructured documents) • Purpose: to gain insight into content of text and text collections • Emerged at the beginning of ’90 with growing size of electronic text documents Document visualization Seesoft Eick, 1992 Tilebar Hearst, 1995 18 / 25
growing size of documents vs. multidimensional browsing • (Wise, 1995: Visualizing non-visual) Spire Wise, 1995 In-Spire Pacific Northwest National Lab. http://in-spire.pnl.gov 2004 ( ThemeView ) Document visualization ( Starlight ) • ( Theme river ) • for temporal patterns 19 / 25
1D techniques 2D techniques nD techniques Table Lens Scatterplots LensBar FacetMaps Maps with bars Enridged contour maps Worldmapper Scatterplot matrix Parallel coords. Dimensional stacking Summary of the first part Network visualization Document visualization Tree-based techniques H3 Edge bundles MBone Linear nD techniques Side-view Top-view 20 / 25
highlighted important parts of data • put “important” into the context of the rest of data Focus & context Fisheye lens [ Furnas, 1981 ] Depth of field … also in scientific visualization [ Kruger, 2006 ] 21 / 25
Emphasizing important information • ( by color, texture, depth of field ) • Cognitive psychology • ( perception, long term vs. short term memory ) Kosara, S-DOF, 2002, 2003 Visual attention 22 / 25
visualizing structure of software modules Program structure Telea, 2002 Application: Software visualization Dynamic memory allocation Moreta, 2006 23 / 25
visualizing mechanical properties of materials (ZCU Plzen) • attempt to visualize many information within a single picture Application: Material properties 24 / 25
Overview of the former and current state of Information visualization was presented • 5 main areas of research (and many derived and combined) • 1D techniques • 2D techniques • nD techniques • Tree and graph-based visualization • Network structure visualization • Focus & context paradigm • Real-life application: software visualization • Two future directions: • Perception and cognition studies • Large and dynamic data visualization Summary & conclusion 25 / 25
Actual papers and references used in this presentation can be found • in the supplementary material distributed with this presentation. • This work has been supported by the project 3DTV NoE FP6 No: 511568 • and Ministry of Education, Youth and Sports of the Czech Republic • project VIRTUAL No: 2C06002. Thank you Slavomir Petrik, Vaclav Skala Center of Computer Graphics and Visualization http://herakles.zcu.cz University of West Bohemia Plzen, Czech Republic, 2007