Download
1 / 40
400 likes | 517 Views
INTRODUCTION TO VISUALIZATION. Alan B. Craig, Ph.D. Materials from: Dr. Alan Shih, Dave Bock, and Alan Craig, plus all the researchers who provided examples National Center for Supercomputing Applications University of Illinois at Urbana-Champaign. June 3, 2010. What Is Visualization?!.

E N D
INTRODUCTION TO VISUALIZATION Alan B. Craig, Ph.D. Materials from: Dr. Alan Shih, Dave Bock, and Alan Craig, plus all the researchers who provided examples National Center for Supercomputing ApplicationsUniversity of Illinois at Urbana-Champaign June 3, 2010
What Is Visualization?! • Visualization existed before the invention of computers • Representation of information allowing us to perceive such information visually Dr. Alan M. Shih
Early Representation • The Cave of Lascaux, France ~15,000 years old - Tells a story
Planetary Orbits • Tenth century • Inclinations of the planetary orbits as a function of time. • Oldest known attempt to show changing values graphically.
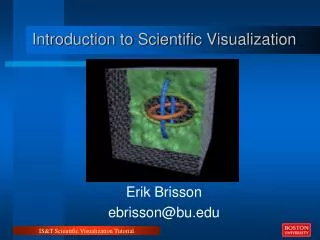
1987 NSF Panel Initiative - Formal Definition • "Visualization is a method of computing. It transforms the symbolic into the geometric, enabling researchers to observe their simulations and computations. Visualization offers a method for seeing the unseen. It enriches the process of scientific discovery and fosters profound and unexpected insights.” • Richard Hamming: "The purpose of computing is insight, not numbers." • Goal of visualization - leverage existing scientific methods by providing new scientific insight through visual methods.
Why do we do it? • Because we NEED to...
Purpose of Visualization • Self study / analysis • interactive exploration • gain understanding • Between Peers • Probing inside the problem domain • Analyzing data • Communicating with peers • Presentation to General Public • Overall visualization • Presentation of data • Communicating with general audience
Data Sources • Computational Sciences • Computational Fluid Dynamics • Computational Structured Mechanics • Computational Chemistry • Computational ….. • Observed Data • Wind Tunnels • Field Observations • Space Probes Dr. Alan M. Shih
What is Visualization • Choice of appropriate representation
Computational Sciences • We can realize, without physical prototypes • the performance of a design • the possible outcome of a scenario • the physical details that we did not know or notice • Benefits • Reduces development cost • Reduces development time • Reduces development risk Dr. Alan M. Shih
Computational Sciences • Computers brought about the ability to collect, create, and store more information • Is a process of simulating a relevant subset of the laws of nature through a set of equations • Yields a set of numeric solutions -- Numbers, LOTS of them • May not be able to see, much less interpret, all of the results. Dr. Alan M. Shih
Visualization of Data • Try to envision the domain in your mind Dr. Alan M. Shih
Visualization of Data • But, with some modifications to the images... Dr. Alan M. Shih
Visualization of Data • Interpolated vs. Non-interpolated Dr. Alan M. Shih
Interactive or Batch? • Interactive Visualization • Allows the Ability to Control in Real-Time • Limits the Amount of Data to Be Visualized. • Useful for Analysis and Exploration • Batch Visualization • High-Quality, Complex Representation • No Control in Real Time. • Useful for Presentation, Communication, high complexity
The Visualization Pipeline • Data (simulated or observed) • Filter • Map to geometry • Viewing Attributes • Object Attributes • Render • Display • Record • Loop to appropriate step...
Computer Art and Scientific Visualization Cox, Donna; Patterson, Robert; Bargar, Robin; Daab, Fred; Moore, Michael; Moorman, Jan; Waegner, Chris; Erickson, Christian; Swing, Chris; Conrad, Renee; Knocke, Joel; Jordan, Robert; Brandys, Mike; Fossum, Barbara; Colby, Don; McNeil, Mike; Bajuk, Mark; Arrott, Matthew; Swanson, Amy Researchers Cerco, Carl; Noel, Mark; CEWES Visualizaiton Stein, Robert; Shih, Alan; NCSA Dr. Alan M. Shih
Static vs. Time-Varying Data • Static • At an particular instance of time • Particular Point of View, etc. • Time-Varying Animation • Evolving along the time line • Dynamic Data or Point of View
Representational Techniques • Realistic • Abstract Researchers Cooper, David; Caterpillar Inc. Visualization Bajuk, Mark; NCSA , 1991 Researchers Cohen, Josef Visualization Cox, Donna, NCSA; Ellson, Rich; Olano, Marc, Eastman Kodak: Dr. Alan M. Shih
Representation Techniques Texture Mapping Visualization Stein, Robert, Baker, Polly, NCSA, ongoing Sponsored by ARL Dr. Alan M. Shih
Representation Techniques • Ball & Stick • Contour Researchers Herron, David, Eli Lilly & Co. Visualization Thingvold, Jeffrey A.; Sherman, William; NCSA , 1991 Researchers Treutlein, Herbert; Schulten, Klaus; Physics Department Technical University of Munich Visualization Arrott, Matthew; NCSA, 1987 Researcher Taylor, Lafe Visualization Shih, Alan, MSU, 1993 Dr. Alan M. Shih
Representation Techniques • False Color • Height/Deformation Researchers Kovacic, David A., Romme, William H., Despain, Don G. Visualization Craig, Alan; NCSA, 1990 Researchers and visualization Haber, Bob; Lee, Hae-Sung; Koh, Hyun; NCSA, 1989 Dr. Alan M. Shih
Representation Techniques • Particulate/ Trace • Iso-surfaces Researchers Wilhelmson, Robert; Brooks, Harold; Jewett, Brian; Shaw, Crystal; Wicker, Louis; Department of Atmospheric Science and NCSA Visualization Arrott, Matthew; Bajuk, Mark; Thingvold, Jeffrey; Yost, Jeffery; Bushell, Colleen; Brady, Dan; Patterson, Bob Produced by the Visualization Services and Development Group, NCSA Dr. Alan M. Shih
Representation Techniques Data from Aerodynamics and Acoustics of Rotorcraft, W. J. McCroskey, Principal Investigator Animation: FAST Particle Traces: UFAT Dr. Alan M. Shih
Scientific Visualization Damage Structure Researcher Namburu, Raju, CEWES Visualization Boch, David; Heiland, Randy; Baker, Polly; NCSA Stephens, Mike; CEWES Dr. Alan M. Shih
Scientific Visualization Damage Structure -- Animation Researcher Namburu, Raju, CEWES Visualization Boch, David; Heiland, Randy; Baker, Polly; NCSA Stephens, Mike; CEWES
Beyond Visual • Virtual Reality Environment • ImmersaDesk • Cave • Fully immersive sphere • Haptic Devices • Senses of hearing and smelling Dr. Alan M. Shih
Challenging Issues in SciVis • Visualization of Large Data Sets • How to deal with exabytes of data? • Remote Visualization • What is the best way to visualize large data sets on remote mainframe? • Interactive Computation • How to monitor and steer ongoing simulations? • Representation Techniques • How to represent the data that shows more information and shows it more clearly and accurately? • Immersive Technologies Dr. Alan M. Shih
Summary • The advent of computer capacity and power push the envelope of computational sciences and scientific visualization (SciVis) • SciVis has revolutionized the way we do sciences • SciVis provides scientists a process to probe into enormously large data sets, perceive incredible details of the domain, and discover unexpected insights. • Challenging issues in SciVis evolve, but we will continue to face them, solve the problems, and face future challenges. Dr. Alan M. Shih
Visualization Tools Dr. Alan M. Shih
Layers of Information Dr. Alan M. Shih
Contour Surface & Volume Visualization Dr. Alan M. Shih
Composite Representation Dr. Alan M. Shih
Stereo Visualization • Red-Blue Glasses • Lost color • Shutter Glasses • 60 Hz • Synchronized with projected images • Polarized Glasses • Linear (Horizontal/Vertical) • Circular (CW/CCW) • Synchronized with projected images Dr. Alan M. Shih
Red-Blue Stereo Visualization Dr. Alan M. Shih
Animations Dr. Alan M. Shih