Download
1 / 59
660 likes | 1.13k Views
NIH MRI Study of Normal Brain Development AC Evans Ph.D. Brain Development Cooperative Group Pediatric Functional Neuroimaging: a Trans-NIH Workshop May 25, 2004 Contrast changes over time Problems with previous studies Sample sizes too small to detect subtle signals

E N D
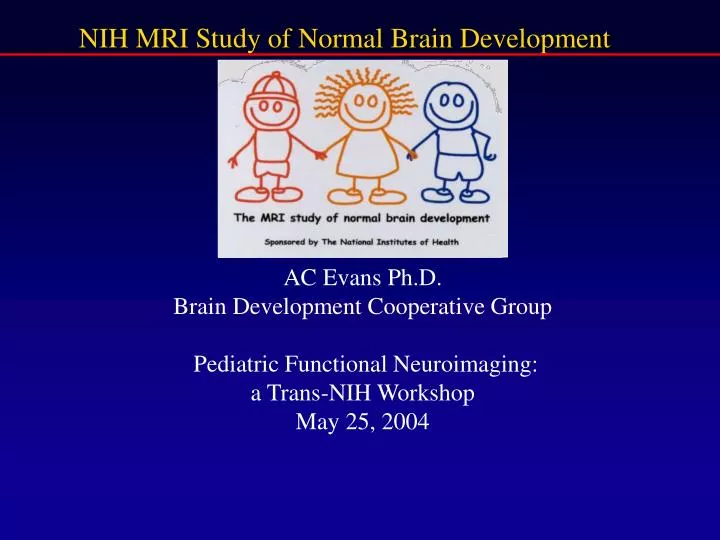
NIH MRI Study of Normal Brain Development AC Evans Ph.D. Brain Development Cooperative Group Pediatric Functional Neuroimaging: a Trans-NIH Workshop May 25, 2004
Problems with previous studies • Sample sizes too small to detect subtle signals • Heterogeneity of subject population • Little longitudinal data • Lack of demographic representativeness • Limited behavioral data for brain-behaviour correlation • Limited MRI data (typically T1 only) • Usually limited analysis techniques
The National Institute on Drug Abuse MRI Study of Normal Brain Development(N=500) Create a database of behavioral and brain MRI development data for 0-18 years Analyze structural-behavioural relationships Develop technique for dissemination of results
Rationale for Project Design • Problem: Existing normative databases limited in size Pooling of databases difficult. Existing databases incompatible in • Slice thickness • Pulse sequence • Demographics • Behavioural tests One centre cannot collect large dataset fast enough to keep pace with technology • Solution: Clinical trial model: multi-centre acquisition, uniform protocol
MRI Objectives • Objective 1: Anatomical MRI/Behavior (5-18) • Objective 2: Anatomical MRI/Behaviour (0-4) • Ancillary A: MR Spectroscopy • Ancillary B: Diffusion Tensor Imaging, Relaxometry
Pediatric Study Centers (PSCs) • Neuropsychiatric Institute and Hospital, UCLA McCracken • Children’s Hospital, Boston Rivkin • Children’s Hospital of Philadelphia Wang • University of Texas-Houston Medical School Brandt • Children’s Hospital Medical Center, Cincinnati Ball • Washington University, St. Louis McKinstry
Data Coordinating Center (DCC) • Overall Direction Evans • Database Zijdenbos, Vins, Charlet, Harlap, Das • Behavioral Liaison Leonard, Milovan • MRI Acquisition Pike, Arnaoutelis • MRI Analysis Collins, Kitching, Lerch • Sampling Plan Lange (Harvard) • Data Transfer Zeffiro, Van Meter (Georgetown) • Scientific Liaison Paus • Clinical Liaison Ad-Dab’bagh, Webster
Clinical Coordinating Center (CCC) – St. Louis Recruitment, behavioral measures selection/certification, exclusions etc. for Obj 1,2 – Botteron, Almli Behavioral QC – Rainey, Henderson, Singer, Smith, Dubois, Warren, Edwards DTI Processing Center (DPC) - NIH Pierpaoli, Basser, Rohde, Chang MRS Processing Center (MPC) – UCLA (?) Alger, O’Neill
NIH MRI Study of Normal Brain Development DCC CCC DPC
Recruitment Procedure • Representative sample based on US 2002 census • Zip code demographic data • Telephone brief screener at recruitment • Telephone long screener for inclusion criteria • DISC, FIGS, CBCL • Hospital Visit (Neuro exam, Behaviour, MRI) • Objective 1 scans 3 times, every 2 years • Objective 2 scans 3-6 times • SES (3 levels) X age (0-18 yrs) X gender X ethnicity
60 50 40 30 20 10 0 4.5 6 7 8 9 10 11 12 13 14 15 16 17 18 Accrual by Age (Objective 1)
Family Income (Raw) N = 409
Parental Education N = 409 NIH MRI Study of Normal Pediatric Development US Population
Ethnicity N = 409
MRI BEHAVIORAL T1W (Obj1+2+fallbacks) Full Interview T2W (Obj1+2+fallbacks) Bayley Mental Handedness PDW (Obj1+2+fallbacks) Bayley Motor JTCI MRS (Obj1+2) Bayley Behavioral Nepsy fluency MRSI (Obj1+2) Brief Interview Neurologicals DTI (Obj1+2) BRIEF Parent PSI Dual-contrast T2 (Obj2) CANTAB Pregnancy T1 Relaxometry (Obj2) Carey Purdue peg board T2 Relaxometry (Obj2) CBCL Tanner CVLT (C and II) TCI DAS Urine and Saliva DISC Digit span and coding DPS4 WASI Exclusion (Obj2) FIGS Woodcock-Johnson III Test Battery
Study Organization Study Subject n-1 Subject n Subject n+1 Visit 1 Visit 2 … Visit n Exclusionary Screening Behavioral Instruments MRI Procedures CBCL DISC CBCL DPS4 JTCI CANTAB WJ3 WASI MRI MRI
PSC DCC Mass Storage System Backup System Internet & DBMS Server(s) Study Work Station Data Warehouse MRI Scanner BVL BVL MRI INTERNET MRI MRI Data Marts MRI Console BVL Behavioral PC (laptop) Scientific Community Data Analysis Pipeline System Architecture
DCC-ID identifiedby candidate for each PSCID personal member of contains data on multiple visits recruited by SessionID Gender ethnic VisitNo psc DoB visit Objective EthnicID Weight CenterID Age stores data for a battery of administered MRI procedures & behavioral instruments Height ObjectiveID Objective MRI procedures behavioral battery of instruments bio figs apib das tanner psi cantab Screening Type DICOM T2W3D wisc exclus disc carey neuro wasi purdue cvltc MRS waisr MINC TestID brief int dps4 hand pls3 wj3 saliva cvlt2 MRSI header CommentID full int cbcl nepsy pregn bayley jtci urine T1W3D PD ScoreID Test ID Candidate Profile are identified by
DBMS Software Platform • MySQL DBMS: • Cross-platform, open source • Robustness, speed, reliability • Low development cost • - Remote management • Graphical User Interface: • Cross platform, Internet enabled application • PHP-based application, complemented by • JavaScript, Java, and Perl for data • manipulation tasks. • Remote management, customizable
Database Summary • Low-cost, extensible, secure • 61 tests, approx. • 20,000 possible data fields (~1000 filled/subject) • Laptop-based behavioral test battery • Automatic MRI data transfer • Web-based behavioral GUI • Interactive 3D MRI web viewer • Automatic QC procedures • Project web site
N=449 N=56 N=188 Obj 1 Obj 2 DTI
Behavioral Instrument Status Total # of Instruments = 9827 Objective 1 = 9029 Objective 2 = 798 Total # in Database = 9827 As of May 20, 2004.
40 30 20 10 Std. Dev = 12.50 Mean = 110.6 N = 248.00 0 75.0 85.0 95.0 105.0 115.0 125.0 135.0 145.0 80.0 90.0 100.0 110.0 120.0 130.0 140.0 FIQ IQ Scores (n=248) FIQ: 110.7+0.8 VIQ: 109.9+08 PIQ: 108.9+0.8
W-J: Passage Comprehension (n=278) r=0.85, p=0.000
WASI: Vocabulary (n=248) r=0.86, p=0.000
Spatial Working Memory (CANTAB): Errors (n=250) r=-0.75, p=0.000
Objective 1 – MRS/I Objective 1 – DTI *Corrected to exclude the early Cincinnati and St. Louis 1 subjects since the DTI product was not available.
QC Overview • Goal: quick turn-around time • mean time for expedited review 1.5 days • median time over all subjects 7.0 days • Concentrated mostly on subject QC
Inter-packet movement • Separate volume into packets • Register each packet to target • Resample and interpolate to 1mm slice thickness After Before
Structural Probability Maps Functional Probability Maps Data Flow for Brain Mapping Data Acquisition : Reconstruction : Conversion to MINC Image Format PET fMRI aMRI Registration aMRI - ePET aMRI - tPET Frame alignment Inter-slice normalization T1/T2/PD/… alignment Registration aMRI - fMRI Partial volume correction Intensity non-uniformity correction Voxel-based model fitting Voxel-based coherence analysis 3D segmentation Stereotaxic Spatial Normalization Inter-volume normalization GLM analysis in 3, 4, or 5D
Manual Auto INSECT ANIMAL SEAL ASP
Age-related changes in WM density Paus et al, Science 1999; n=111 NIHPD; n=204; 16 1 0 t=10.5
WM density and Spatial Working Memory: Between Errors (Age removed) NIHPD; n=188; 7 -1 66 t=-4.0
Automated extraction of both cortical surfaces using CLASP algorithm (5 different brains)
Analysis of detection limits • 19 T1 MRIs of the same subject (Colin Holmes) with 1mm isotropic sampling. • Computation of standard deviations across cortex. • Across blurring kernels. • Across metrics. • Power analysis: • N needed to recover change of 0.5 mm • Change required at N=25 in each group.
Colin’s 19 Brains Average
Required N to recover 0.5 mm Unblurred 5mm 10mm 20mm 200 0