Download
1 / 47
490 likes | 599 Views
Field epidemiology: effect measures, and a cohort study of a food borne outbreak. Simon Thornley. Overview. Introduce how epidemiology can be used to help inform what caused a food borne outbreak Re- inforce ideas of cohort study design and analysis

E N D
Field epidemiology: effect measures, and a cohort study of a food borne outbreak Simon Thornley
Overview • Introduce how epidemiology can be used to help inform what caused a food borne outbreak • Re-inforce ideas of cohort study design and analysis • Consider how other evidence can inform the results of epidemiological study.
Exposure Participants Outcomes
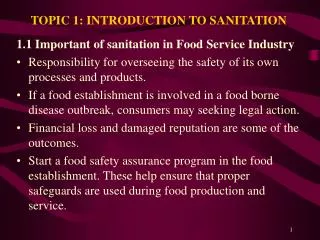
Simple Outbreak • 6 October 2007 • 16 people reported having diarrhoea to North Shore City Council following ‘prize giving’ at North Shore Event Centre • Prize giving was the final event of a week long, international soccer tournament of the South African/Indian, diaspora
First steps: what to do? • Outbreak group • Track down participants • Track down food • Microbiological samples • Assess risk • Immediate action required? • Media/ risk communication?
Hypothesis • Was this outbreak caused by food served at function? Which food? • Epidemiological analysis one tool. • Clinical and microbiological analysis provide complementary
The suspects... Dahl Lamb biryani Vegebiryani
Retrospective cohort Buffers’ dance Dal/ biryani Diarrhoea?
7 6 5 4 frequency 3 2 1 0 9:30:00 a.m. 1:30:00 p.m. 3:30:00 p.m. 5:30:00 p.m. 7:30:00 p.m. 1:30:00 a.m. 3:30:00 a.m. 1:30:00 a.m. 3:30:00 a.m. 5:30:00 a.m. 7:30:00 a.m. 9:30:00 p.m. 11:30:00 a.m. 11:30:00 p.m. 11:30:00 p.m. Time of diarrhoea onset Symptom onset (outbreak curve)
What are the facts? • Facts vsartifacts? • Bias: selection, information • Selection: was the sample representative of the total group? • Would New Zealand cases be more/less likely to be sick? • Case definition?
“Frequentist view” Ground hog day Imagine the event repeated over and over! Assume random probability
Error distribution • Assume outcome is like flipping a biased coin (probability theory) • Consider long run probability associated with biased coin (prob =attack rate) • Bias = attack rate in exposed or unexposed groups
In pictures (dal) If unrelated; chance of diarrhoea after eating dahl =chance of diarrhoea (regardless of meal selection) Actual Diarrhoea No effect Dahl eaten
In pictures (dal) Actual Diarrhoea Odds Ratio =0.77/0.22 =3.5 Dahl exposure
In pictures (dahl) Diarrhoea No effect Odds Ratio =0.61/0.65 ≈1 (no effect) Dahl exposure
In pictures (lamb) Diarrhoea Actual No effect Lamb eaten
In pictures (vege) Diarrhoea No effect Actual
Just consider first exposure! Is dal the likely culprit? What information does the p-value give you? What information does the confidence interval convey? What is the null hypothesis?
Distribution of risk ratio Upper bound of risk ratio is reciprocal of risk in unexposed (28/5 or 5.6)
What do these results mean? • What food caused the outbreak? • What does the 95% confidence interval mean? • Could these results be explained by chance? • Are the populations comparable? • Was some other exposure accounting for this difference?
How do we know differences are real (not due to chance)? We don’t – but Statistics helps us put a number on the uncertainty!
Microbiology • Stool (2/18 received) • Clostridium perfringens (1.0 x 10⁴ CFU/g) • Bacillus cereus • No toxin, no norovirus • Food • Lentils ok • Spices • Turmeric Bacillus cereus (1.0 x10⁴ CFU/g, with faecal coliforms (4.0 MPN/g)
Reject null hypothesis • dallikely to cause outbreak • Relationship between illness and dal confounded by lamb biryani
Putting it all together…. • Turmeric seeded lentil soup with Bacillus cereus • Time and temperature abuse – endotoxin associated diarrhoeal syndrome. • Vegetable biryani protective, few consumed, more likely to be heated in bain-marie. • Likely temperature labile toxin.
Room set up Lamb biryani and dal Vegebiryani and dal
Don’t forget the Public Health Action • Is routinely contaminated turmeric ok? • What should we do with the cook? • Legal action justified?
Summary • Epidemiology- distribution and determinants of health • Study design – take into account factors such as cost, speed, causation, ethical issues • Statistics P-value yes/no cf. 95% confidence interval • Put results together with other analysis • Unexpected results!