Download
1 / 29
290 likes | 806 Views
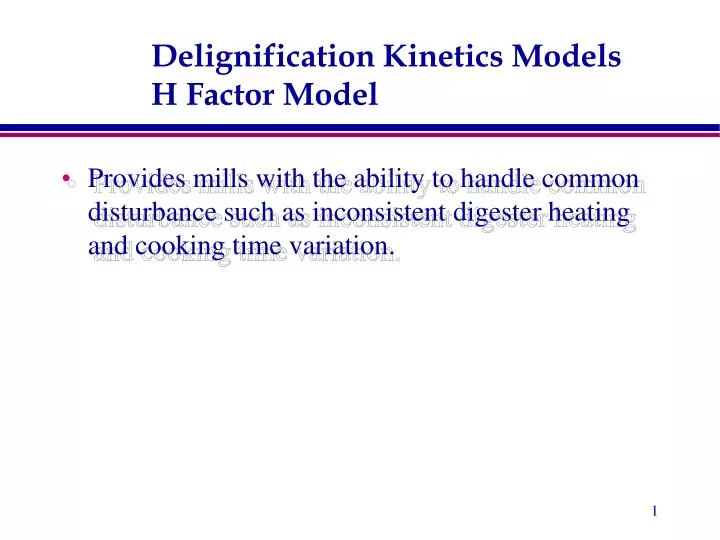
Delignification Kinetics Models H Factor Model. Provides mills with the ability to handle common disturbance such as inconsistent digester heating and cooking time variation. 170. 900. 700. 130. Relative Reaction Rate. 500. H factor equal to area under this curve. Temperature °C. 300.

E N D
Delignification Kinetics ModelsH Factor Model • Provides mills with the ability to handle common disturbance such as inconsistent digester heating and cooking time variation.
170 900 700 130 Relative Reaction Rate 500 H factor equal to area under this curve Temperature °C 300 90 100 1 2 Hours from Start Delignification Kinetics ModelsH Factor/Temperature
Delignification Kinetics ModelsH Factor Model k0 is such that H(1 hr, 373°K) = 1 Relative reaction rate
Delignification Kinetics ModelsH Factor Model • Uses only bulk delignification kinetics k = Function of [HS-] and [OH-] R = T [=] °K
Kappa orYield 15% EA 15% EA 15% EA 18% EA 20% EA H-factor Empirical Kraft Pulping Models • Models developed by regression of pulping study results • Excellent for digester operators to have for quick reference on relation between kappa and operating conditions • “Hatton” models are excellent examples of these
Emperical Kraft Pulping Models Hatton Equation Kappa (or yield) = -(log(H)*EAn) ,, and n are parameters that must be fit to the data. Values of ,, and n for kappa prediction are shown in the table below. Warning: These are empirical equations and apply only over the specified kappa range. Extrapolation out of this range is dangerous!
Delignification Kinetics ModelsKerr model ~ 1970 • H factor to handle temperature • 1st order in [OH-] • Bulk delignification kinetics w/out [HS-] dependence
Delignification Kinetics ModelsKerr model ~ 1970 Integrated form: H-Factor Functional relationship between L and [OH-]
Delignification Kinetics ModelsKerr model ~ 1970 Slopes of lines are not a function of EA charge
Delignification Kinetics ModelsKerr model ~ 1970 Model can handle effect of main disturbances on pulping kinetics • Variations in temperature profile • Steam demand • Digester scheduling • Reaction exotherms • Variations in alkali concentration • White liquor variability • Differential consumption of alkali in initial delignification • Often caused by use of older, degraded chips • Good kinetic model for control
Delignification Kinetics ModelsUW model • Divide lignin into 3 phases, each with their own kinetics • 1 lignin, 3 kinetics • Transition from one kinetics to another at a given lignin content that is set by the user. For softwood: Initial to bulk ~ 22.5% on wood Bulk to residual ~ 2.2% on wood
Delignification Kinetics ModelsUW model • Initial • dL/dt = k1L • E ≈ 9,500 cal/mole • Bulk • dL/dt = (k2[OH-] + k3[OH-]0.5[HS-]0.4)L • E ≈ 30,000 cal/mole • Residual • dL/dt = k4[OH-]0.7L • E ≈ 21,000 cal/mole
Model PerformanceUW model Pulping data for thin chips – Gullichsen’s data
Model PerformanceUW model Pulping data for mill chips - Gullichsen’s data
Model PerformanceUW model Virkola data on mill chips
Model Performance (Andersson)UW Model Model works well until very low lignin content
Carbohydrate Loss Models Modeling yield prediction – A Very Difficult Modeling Problem
UW Model • Two methods have been tested, but since both have the same accuracy, the simplest has been retained.
UW: Model I Basic Structure: dc/dt=k*dL/dt Some physical justification for this is given by carbohydrate-lignin linkages. Carbohydrates lumped into a single group.
Gustafson: Model I • Carbohydrate/lignin relation is assumed to be stable and not a strong function of pulping conditions. • Selectivity of reactions assumed to be slightly dependent on OH- but independent of temperature. • Yield/kappa relationship can be improved by using both lower pulping temperature and less alkali.
Model PerformanceUW model Virkola data on mill chips
Prediction of pulp viscosity Dependence of viscosity on pulping conditions was modeled • Viscosity is a measure of degradation of cellulose chains • Effect of temperature, alkalinity, initial DP, and time on viscosity is modeled • Model is compared with experimental data from two sources
[OH-] & [HS-] Predictions • Calculated by stoichiometry in all models as follows:
Model PerformanceUW model Gullichsen data on mill chips