Download
1 / 30
660 likes | 1.09k Views
Project Quality Management. PMI Knowledge Areas . The Importance of Project Quality Management. Scope. Cost. Time. The Importance of Project Quality Management. People seem to accept systems being down occasionally or needing to reboot their PCs

E N D
Project Quality Management PMI Knowledge Areas
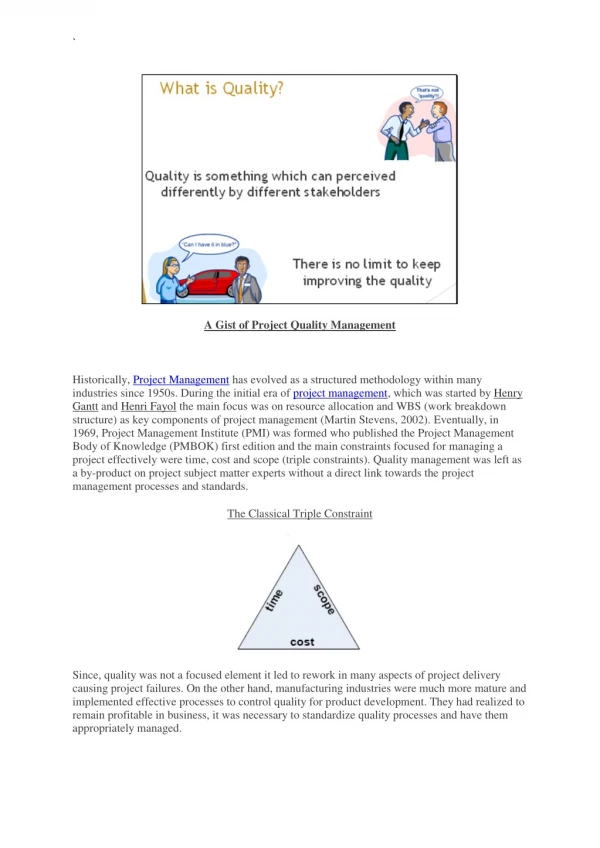
The Importance of Project Quality Management Scope Cost Time
The Importance of Project Quality Management • People seem to accept systems being down occasionally or needing to reboot their PCs • But quality is very important in many IT projects
What Is Project Quality? • The International Organization for Standardization (ISO) defines quality as “the degree to which a set of inherent characteristics fulfils requirements” (ISO9000:2000) Who ultimately decides if quality is acceptable?
The Cost of Quality • The cost of quality is the cost of conformance plus the cost of nonconformance • Conformance • Cost of nonconformance • Cost Categories Related to Quality • Prevention cost • Appraisal cost • Internal failure cost • External failure cost • Measurement and test equipment costs
Project Quality Management • Software bugs account for about 40% computer systems failure • Software horror stories • www.risks.org • http://www.cs.tau.ac.il/~nachumd/horror.html • In 2008, software glitch was the reason for London Stock Exchange (LSE) failure • In 2003, software failure caused blackout in the Northeast corridor of the U.S. and parts of Canada 6
Major software defects What will top 2013? http://blog.inthewildtesting.com/the-top-10-software-bugs-of-2012/2012/12/
What Is Project Quality Management? • Project quality management ensures that the project will satisfy the needs for which it was undertaken • Processes include: • Planning quality management (Planning) • Performing quality assurance (Executing) • Performing quality control (Control/Monitor)
Project Quality Management Summary Information Technology Project Management, Seventh Edition
Planning Quality • Implies the ability to anticipate situations and prepare actions to bring about the desired outcome • Important to prevent defects by: • Selecting proper materials • Training and indoctrinating people in quality • Planning a process that ensures the appropriate outcome
Quality and IT Projects • Customers have difficulty explaining exactly what they want in an IT project. • What are the important scope aspects of IT projects that impact quality?
Who’s Responsible for the Quality of Projects? • Project managers are ultimately responsible for quality management on their projects • Several organizations and references can help project managers and their teams understand quality • International Organization for Standardization (www.iso.org) • IEEE (www.ieee.org)
2) Performing Quality Assurance • Quality assurance includes all the activities related to satisfying the relevant quality standards for a project • Another goal of quality assurance is continuous quality improvement • Performing Quality Assurance through: • Benchmarking • Quality audits
Testing • Many IT professionals think of testing as a stage that comes near the end of IT product development
Types of Tests • Unit testing • Integration testing • System testing • User acceptance testing Information Technology Project Management, Seventh Edition
Testing Alone Is Not Enough • Watts S. Humphrey, a renowned expert on software quality, defines a software defect as anything that must be changed before delivery of the program • Testing does not sufficiently prevent software defects because • Why?
Program inspections • These are peer reviews where engineers examine the source of a system with the aim of discovering anomalies and defects. • Inspections do not require execution of a system so may be used before implementation.
Inspection checklists • Checklist of common errors should be used to drive the inspection. • Examples: Initialisation, Constant naming, loop termination, array bounds, etc.
3) Controlling Quality • The main outputs of quality control are: • Acceptance decisions • Rework • Process adjustments • Seven Basic Tools of Quality • Flowchart • Run Chart • Scatter Diagram • Histogram • Pareto Diagram • Control Chart • Cause and Effect Diagram
Flowcharts • Flowcharts are graphic displays of the logic and flow of processes that help you analyze how problems occur and how processes can be improved
Run Charts • A run chart displays the history and pattern of variation of a process over time.
Scatter diagram • A scatter diagram helps to show if there is a relationship between two variables
Histograms • A histogram is a bar graph of a distribution of variables
Pareto Charts • A Pareto chart is a histogram that can help you identify and prioritize problem areas
Quality Control Charts • A control chart is a graphic display of data that illustrates the results of a process over time • The main use of control charts is to prevent defects, rather than to detect or reject them
The Seven Run Rule • You can use quality control charts and the seven run rule to look for patterns in data • The seven run rule states that if seven data points in a row are all below the mean, above the mean, or are all increasing or decreasing, then the process needs to be examined for non-random problems Information Technology Project Management, Seventh Edition
Checksheet • used to collect and analyze data
Cause-and-Effect Diagrams • Cause-and-effect diagrams • They help you find the root cause of a problem • aka fishbone or Ishikawa diagrams