Download
1 / 34
450 likes | 780 Views
Project Quality Management. What Is Project Quality?. The International Organization for Standardization (ISO) defines quality as “the degree to which a set of inherent characteristics fulfils requirements” (ISO9000:2000) Other experts define quality based on:

E N D
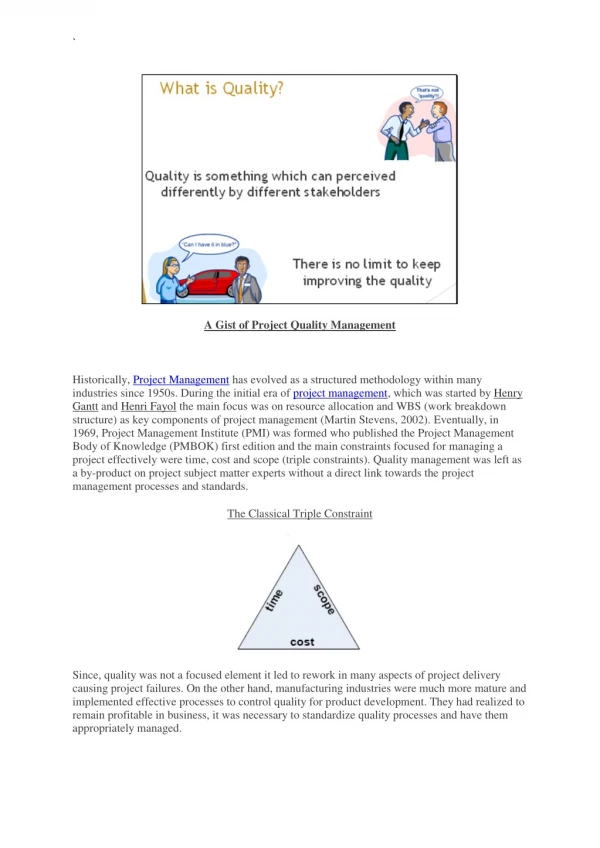
What Is Project Quality? The International Organization for Standardization (ISO) defines quality as “the degree to which a set of inherent characteristics fulfils requirements” (ISO9000:2000) Other experts define quality based on: • Conformance to requirements: the project’s processes and products meet written specifications • Fitness for use: a product can be used as it was intended Information Technology Project Management, Sixth Edition
What Is Project Quality Management? Project quality management ensures that the project will satisfy the needs for which it was undertaken Processes include: • Planning quality: identifying which quality standards are relevant to the project and how to satisfy them; a metric is a standard of measurement • Performing quality assurance: periodically evaluating overall project performance to ensure the project will satisfy the relevant quality standards • Performing quality control: monitoring specific project results to ensure that they comply with the relevant quality standards Information Technology Project Management, Sixth Edition
Planning Quality Implies the ability to anticipate situations and prepare actions to bring about the desired outcome Important to prevent defects by: • Selecting proper materials • Training and indoctrinating people in quality • Planning a process that ensures the appropriate outcome Information Technology Project Management, Sixth Edition
Design of Experiments Design of experiments is a quality planning technique that helps identify which variables have the most influence on the overall outcome of a process Also applies to project management issues, such as cost and schedule trade-offs Involves documenting important factors that directly contribute to meeting customer requirements Information Technology Project Management, Sixth Edition
Scope Aspects of IT Projects Functionality is the degree to which a system performs its intended function Features are the system’s special characteristics that appeal to users Systemoutputs are the screens and reports the system generates Performance addresses how well a product or service performs the customer’s intended use Reliability is the ability of a product or service to perform as expected under normal conditions Maintainability addresses the ease of performing maintenance on a product Information Technology Project Management, Sixth Edition
Performing Quality Assurance Quality assurance includes all the activities related to satisfying the relevant quality standards for a project Another goal of quality assurance is continuous quality improvement Benchmarking generates ideas for quality improvements by comparing specific project practices or product characteristics to those of other projects or products within or outside the performing organization A quality audit is a structured review of specific quality management activities that help identify lessons learned that could improve performance on current or future projects Information Technology Project Management, Sixth Edition
Quality Control The main outputs of quality control are: • Acceptance decisions • Rework • Process adjustments There are Seven Basic Tools of Quality that help in performing quality control Information Technology Project Management, Sixth Edition
Cause-and-Effect Diagrams Cause-and-effect diagrams trace complaints about quality problems back to the responsible production operations They help you find the root cause of a problem Also known as fishbone or Ishikawa diagrams Can also use the 5 whys technique where you repeated ask the question “Why” (five is a good rule of thumb) to peel away the layers of symptoms that can lead to the root cause Information Technology Project Management, Sixth Edition
Figure 8-2. Sample Cause-and-Effect Diagram Information Technology Project Management, Sixth Edition
Quality Control Charts A control chart is a graphic display of data that illustrates the results of a process over time The main use of control charts is to prevent defects, rather than to detect or reject them Quality control charts allow you to determine whether a process is in control or out of control • When a process is in control, any variations in the results of the process are created by random events; processes that are in control do not need to be adjusted • When a process is out of control, variations in the results of the process are caused by non-random events; you need to identify the causes of those non-random events and adjust the process to correct or eliminate them Information Technology Project Management, Sixth Edition
The Seven Run Rule You can use quality control charts and the seven run rule to look for patterns in data The seven run rule states that if seven data points in a row are all below the mean, above the mean, or are all increasing or decreasing, then the process needs to be examined for non-random problems Information Technology Project Management, Sixth Edition
Run Chart A run chart displays the history and pattern of variation of a process over time It is a line chart that shows data points plotted in the order in which they occur Can be used to perform trend analysis to forecast future outcomes based on historical patterns Information Technology Project Management, Sixth Edition
Figure 8-4. Sample Run Chart Information Technology Project Management, Sixth Edition
Scatter Diagram A scatter diagram helps to show if there is a relationship between two variables The closer data points are to a diagonal line, the more closely the two variables are related Information Technology Project Management, Sixth Edition
Figure 8-5. Sample Scatter Diagram Information Technology Project Management, Sixth Edition
Histograms A histogram is a bar graph of a distribution of variables Each bar represents an attribute or characteristic of a problem or situation, and the height of the bar represents its frequency Information Technology Project Management, Sixth Edition
Figure 8-6. Sample Histogram Information Technology Project Management, Sixth Edition
Flowcharts Flowcharts are graphic displays of the logic and flow of processes that help you analyze how problems occur and how processes can be improved They show activities, decision points, and the order of how information is processed Information Technology Project Management, Sixth Edition
Figure 8-8. Sample Flowchart Information Technology Project Management, Sixth Edition
Six Sigma *Pande, Peter S., Robert P. Neuman, and Roland R. Cavanagh, The Six Sigma Way, New York: McGraw-Hill, 2000, p. xi. Six Sigma is “a comprehensive and flexible system for achieving, sustaining, and maximizing business success. Six Sigma is uniquely driven by close understanding of customer needs, disciplined use of facts, data, and statistical analysis, and diligent attention to managing, improving, and reinventing business processes.”* Information Technology Project Management, Sixth Edition
Basic Information on Six Sigma The target for perfection is the achievement of no more than 3.4 defects per million opportunities The principles can apply to a wide variety of processes Six Sigma projects normally follow a five-phase improvement process called DMAIC Information Technology Project Management, Sixth Edition
DMAIC DMAIC is a systematic, closed-loop process for continued improvement that is scientific and fact based DMAIC stands for: • Define: define the problem/opportunity, process, and customer requirements • Measure: define measures, then collect, compile, and display data • Analyze: scrutinize process details to find improvement opportunities • Improve: generate solutions and ideas for improving the problem • Control: track and verify the stability of the improvements and the predictability of the solution Information Technology Project Management, Sixth Edition
Six 9s of Quality Six 9s of quality is a measure of quality control equal to 1 fault in 1 million opportunities In the telecommunications industry, it means 99.9999 percent service availability or 30 seconds of down time a year This level of quality has also been stated as the target goal for the number of errors in a communications circuit, system failures, or errors in lines of code Information Technology Project Management, Sixth Edition
Testing Many IT professionals think of testing as a stage that comes near the end of IT product development Testing should be done during almost every phase of the IT product development life cycle Information Technology Project Management, Sixth Edition
Figure 8-10. Testing Tasks in the Software Development Life Cycle Information Technology Project Management, Sixth Edition
Types of Tests Unit testing tests each individual component (often a program) to ensure it is as defect-free as possible Integration testing occurs between unit and system testing to test functionally grouped components System testing tests the entire system as one entity User acceptance testing is an independent test performed by end users prior to accepting the delivered system Information Technology Project Management, Sixth Edition
Testing Alone Is Not Enough Watts S. Humphrey, a renowned expert on software quality, defines a software defect as anything that must be changed before delivery of the program Testing does not sufficiently prevent software defects because: • The number of ways to test a complex system is huge • Users will continue to invent new ways to use a system that its developers never considered Humphrey suggests that people rethink the software development process to provide no potential defects when you enter system testing; developers must be responsible for providing error-free code at each stage of testing Information Technology Project Management, Sixth Edition
Modern Quality Management Modern quality management: • Requires customer satisfaction • Prefers prevention to inspection • Recognizes management responsibility for quality Information Technology Project Management, Sixth Edition
Improving Information Technology Project Quality Suggestions for improving quality for IT projects include: • Establish leadership that promotes quality • Understand the cost of quality • Focus on organizational influences and workplace factors that affect quality • Follow maturity models Information Technology Project Management, Sixth Edition
Leadership As Joseph M. Juran said in 1945, “It is most important that top management be quality-minded. In the absence of sincere manifestation of interest at the top, little will happen below.”* A large percentage of quality problems are associated with management, not technical issues *American Society for Quality (ASQ), (www.asqc.org/about/history/juran.html). Information Technology Project Management, Sixth Edition
The Cost of Quality The cost of quality is the cost of conformance plus the cost of nonconformance • Conformance means delivering products that meet requirements and fitness for use • Cost of nonconformance means taking responsibility for failures or not meeting quality expectations A study reported that software bugs cost the U.S. economy $59.6 billion each year and that one third of the bugs could be eliminated by an improved testing infrastructure Information Technology Project Management, Sixth Edition
Using Software to Assist in Project Quality Management Spreadsheet and charting software helps create Pareto diagrams, fishbone diagrams, and so on Statistical software packages help perform statistical analysis Specialized software products help manage Six Sigma projects or create quality control charts Project management software helps create Gantt charts and other tools to help plan and track work related to quality management Information Technology Project Management, Sixth Edition
Chapter Summary Project quality management ensures that the project will satisfy the needs for which it was undertaken Main processes include: • Plan quality • Perform quality assurance • Perform quality control Information Technology Project Management, Sixth Edition