Download
1 / 57
610 likes | 878 Views
History of National Debt. Some History http://www.publicdebt.treas.gov/history/history.htm http://www.treasurydirect.gov/govt/reports/pd/histdebt/histdebt.htm Current News on National Debt http://www.fms.treas.gov/bulletin/index.html. Debt vs. Deficit.

E N D
History of National Debt • Some History • http://www.publicdebt.treas.gov/history/history.htm • http://www.treasurydirect.gov/govt/reports/pd/histdebt/histdebt.htm • Current News on National Debt • http://www.fms.treas.gov/bulletin/index.html
Debt vs. Deficit • A budget deficit occurs when government revenue in a given year is less than government spending in the same year. • The national debt is the accumulation of budget deficits over time. • For example…. • if a government received $10 and spent $15 in a given year, the budget deficit would be -$5 • if a government repeated this same budget deficit for 10 years, the national debt would be -$50 • Since World War II, the U.S. has had a budget deficit (i.e. spent more than it received) in virtually every single year. • The last time the budget deficit vanished was in the latter years of the Clinton administration (late 1990s).
Past and Future Deficitshttp://www.cbo.gov/publication/45229
Government Revenue and Spendinghttp://www.cbo.gov/publication/45229
U.S. Budget Deficits as Percentage of GDPColander (2013) Deficits and debt relative to GDP provide measures of a country’s ability to pay off a deficit and service its debt Deficits as percentage of GDP 10 0 -10 -20 -30 Colander, Economics 1900 1920 1940 1960 1980 2000 2020
http://www.businessinsider.com/facts-about-debt-and-deficits-2013-10http://www.businessinsider.com/facts-about-debt-and-deficits-2013-10
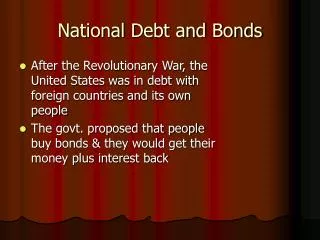
Debt in the 19th century • The U.S. has had debt since its inception. Records show that debts incurred during the American Revolutionary War amounted to $75,463,476.52 by January 1, 1791. http://www.publicdebt.treas.gov/history/history.htm • The National Debt in 1816 was $127 million • Andrew Jackson reduced the National Debt to zero (or virtually zero) in 1835 THIS IS THE ONLY TIME DEBT WAS ZERO – AND IT DIDN’T LAST FOR MORE THAN A COUPLE OF YEARS. SO THE U.S. HAS BEEN IN DEBT CONTINUOUSLY SINCE 1837. • The National Debt in 1839 was $10 million • The National Debt in 1851 was $68 million • The National Debt in 1866 was $2.77 billion • By 1891 the National Debt had fallen to $1.546 billion (the lowest it was from the Civil War to World War I)
Debt in the 20th century • The National Debt in 1919 was $27.4 billion • The National Debt in 1930 was only $16.2 billion • By 1946, the National Debt was $269.4 billion (as we will note… this was when the nation’s debt-to-GDP ratio was at its highest) • 1957 was the last year – in the data set examined in class – the National Debt fell. It was $270.5 billion that year. • 1963: $305.9 billion • 1972: $427.3 billion • 1975: $533.2 billion • 1982: $1.14 trillion • 1986: $2.13 trillion • 1992: $4.06 trillion • 2000: $5.67 trillion
Debt in the past decade • Note: numbers taken from December of each year. • 2002: $6.4 trillion • 2003: $7.0 trillion • 2004: $7.6 trillion • 2005: $8.2 trillion • 2006: $8.7 trillion • 2007: $9.2 trillion • 2008: $10.7 trillion • 2009: $12.3 trillion • 2010: $14.1 trillion • 2011: $15.2 trillion • 2012: $16.5 trillion • 2013: $17.4 trillion
What Causes the national debt to rise? • Debt occurs when government revenue (primarily from taxes) is less than government spending. • Therefore debt will rise whenever.. • revenue falls: this happens when the economy goes into recession and when we decide to cut taxes • spending increases: this can happen when we go to war
Sources of Federal Revenuehttp://www.theatlantic.com/business/archive/2014/04/how-america-pays-taxes-in-10-not-entirelydepressing-charts/360647/
What does the federal government currently spend money on? • http://www.whitehouse.gov/taxreceipt • National Defense: 24.6% • Health Care: 22.5% • Job and Family Security: 17.3% • Everything Else is less than 36% • everything else includes education, veterans benefits, national resources, foreign aid, NASA, Immigration, response to natural disasters, and interest on the debt. The biggest expenditures of the federal government are Social Security, Medicare and Medicaid, and National Defense The biggest expenditure of the state and local government is education.
What the Federal Budget is Spent Uponhttp://www.theatlantic.com/business/archive/2014/04/how-america-pays-taxes-in-10-not-entirely-depressing-charts/360647/
Military spending around the worldhttp://www.sipri.org/research/armaments/milex/factsheet2010
How the government pays? • Most Governments use both taxes and debt • As we have seen, the U.S. government has been in debt for almost its entire history • The debt from World War II – when the GDP-to-Debt ratio reached its highest point – was never repaid • Still… isn’t $17 trillion in debt a significant problem?
What can a government do when its bonds mature (i.e. it is time to pay)? • Option One: Bonds could be redeemed with no new bonds issued (i.e. the government can pay off its debt) • http://noahpinionblog.blogspot.com/2013/10/borrowing-from-future-except-that-we.html • This would reduce the amount of bonds in private portfolios, but it would give the ex-bondholders an equivalent amount of cash to spend on something else. The cash comes from a budget surplus, which means that taxpayers have paid in extra. Those who don’t own bonds are now net payers to those who do. From an accounting standpoint, however, they also gain in the sense that they are no longer liable to pay a stream of interest on the bonds into the future. • Historically, this doesn’t happen very much. The best example is the huge deficits that the US and Britain used to finance WWII. Neither country ran equivalent surpluses later on to “pay off” the debt. Their economies grew, inflation eroded debt claims, and over time the debt-to-GDP levels slid back down to more reasonable levels.
What can a government do when its bonds mature (i.e. it is time to pay)? • Option Two: Roll over the debt (i.e. issue more bonds to finance the redemption of the old bonds) • This is what we did with respect to World War II debt (and what we have essentially done with some debt since 1837). • http://noahpinionblog.blogspot.com/2013/10/borrowing-from-future-except-that-we.html • As Noah Smith notes: That’s what happens in 99% of the cases, and you can see this by looking at how small and infrequent fiscal surpluses actually are.
Back to the Bank of England • SEE BRIEF VIDEO: http://www.bbc.co.uk/programmes/p00vpwhd • Key Quote: “The Bank of England was designed to provide a long-term loan to the government that wasn’t designed to be paid back. People loaned money to the government to get interest on that loan. If they wanted their money back they simply sold their shares.”
What can a government do when its bonds mature (i.e. it is time to pay)? • Option Three: Default • As Noah Smith notes: Banana republics and governments under the influence of suicide cults sometimes do this. • http://noahpinionblog.blogspot.com/2013/10/borrowing-from-future-except-that-we.html
Are we borrowing from the future? • So where is “borrowing from the future”? Well, all government is borrowing from some people to pay other people, and paying back these debts, should it ever happen, simply reverses that flow. Either way, money is making its way from one group to another at the same point in time. Note that interest on the debt has nothing to do with present vs future either: the current generation, which incurs the debt, begins paying interest immediately in exactly the same way their distant descendants will. • So there you have it. At an individual level, borrowing is truly borrowing from the future. At a population level, borrowing is the creation of assets and liabilities across different people. People like King are committing a fallacy of composition. • http://noahpinionblog.blogspot.com/2013/10/borrowing-from-future-except-that-we.html
Because you plan to stop working at some point, you must eventually consume less than you earn. In other words, individuals have to save. Governments do not retire. So they do not have to save. • In other words…government debt is ongoing, but individual debt must eventually be repaid. • Because government never retires and always earns an income, markets may be willing to lend at very low rates. This is especially true for very rich countries (like the U.S.). The current interest rate on U.S. debt is close to 0%. You are not a Government!or… why the national debt may not be as important as people claim!!!
Government can print money to pay off debt. Although this is not generally a good idea, people – and some nations – do not have this option. And when this option does not exist, debt can become a very big problem. As we will see… most of the government’s debt is internal debt, or debt owed to the government (yes, the government owes money to itself) or to its citizens. Paying interest on internal debt redistributes income, but does not cause a net reduction in income of the average citizen. More on how government debt is different
Colander, Economics Ownership of the Debtfrom David Colander (2013) Other U.S. government trust funds, 12% Social Security trust fund, 18% Federal Reserve, 11%
More recent data on debt ownership Sources:US Treasury Department http://www.fms.treas.gov/bulletin/index.html see Ownership of Federal Securities For Foreign Ownership: http://www.treasury.gov/resource-center/data-chart-center/tic/Documents/mfh.txt
The household analogy doesn’t work (again, you are not a government). But thinking of households does offer some insight. • Imagine a household borrows $200,000. Is this a good decision? • If a person only earns $10,000 a year, then no. • If a person earns close to $100,000 a year, then this is not a bad financial decision. • Key point: We need to consider income – or GDP – in evaluating the national debt. The DeBt to GDP Ratio
From 1940 to 1946, the national debt increased from $40 billion to more than $260 billion. So debt went up 6 times (debt has increased about 6 times from 1987 to 2012). The Debt-to-GDP ratio in 1946 was 1.21 (or 121%) What happened to this debt? From 1946 to 2012, the national debt has only declined 5 times and we only reduced the amount by $23 billion. In other words, we never paid the debt from World War II. So what happened? Back to World war ii
From 1946 to 2012, nominal GDP has increased from about $220 billion to over $15 trillion. • That means our debt from World War II is simply insignificant compared to the size of our national economy. • IT IS IMPORTANT TO REMEMBER... Why debt may not matter over time
Growth Happens!! • Real GDP per-capita has increased in every decade in U.S. history. • Growth was faster in the 20th century (relative to the 19th century). • Average annual growth in the 20th century was about 2% per year. • For the past 100 years…. • Real Gross Domestic Product has increased (on average) 3.4% in each year • Real GDP per capita has increased (on average) 2.1% in each year
Again, why does growth happen?http://www.vox.com/2014/4/20/5624018/should-technology-define-generations
Here is the 21st Century • Growth in real per capita income is 2.1% (last 100 years average) • Growth in real GDP is 3.4% (last 100 years average) • Projected national debt assume ratio of debt to income of 75%
http://www.businessinsider.com/facts-about-debt-and-deficits-2013-10http://www.businessinsider.com/facts-about-debt-and-deficits-2013-10
Putting U.S. Debt into perspective: History of Debt in the United Kingdom
Colander, Economics U.S. Debt Compared to Foreign Debt from Colander (2013) The U.S. debt does not appear so large when compared to the debts of some other countries in the early 2000s 82% 82% 80% 68% 52% 42% 37% 23% Debt as a Percentage of GDP
Simple Thought Experiment… • The simple projection says real GDP is $80 trillion in 2091 • If the Debt-to-GDP ratio is 0.75; what is the national debt in 2091? • Is this a problem? • Today the national debt is $17 trillion. At the end of World War II, nominal GDP was only $228 billion (real GDP was $2.2 trillion). What do you think people in 1945 would think if they knew the size of our national debt today?
Two Debt Myths • Government debt must be paid so our children will be paying the U.S. national debt (already have seen this is not true) • Foreigners own a substantial part of our debt. Specifically, we owe the Chinese much of our national debt.
how much U.S. Debt does china have? • Debt held by China: • US debt holdings: $1.2trillion • http://www.treasury.gov/resource-center/data-chart-center/tic/Documents/mfh.txt • In other words, China owns about 7.3% of the U.S. national debt. • Japan holds about 6.8% of our debt. Yes, Japan – who has a higher debt-GDP ratio than the U.S. – owns quite a bit of our debt • Why do these nations hold our debt? These nations hold U.S. debt for the same reason anyone else holds U.S. debt: U.S. treasuries are a very safe investment and a very liquid investment.
Promoting economic growth and stability • In 1946, Congress officially made it the federal government’s responsibility to promote economic growth and maintain economic stability (with the Full Employment Act) • The economy has been more stable since the end of World War II (see the slides on the history of economic growth for the evidence) • Both Republicans and Democrats support government intervention in the economy when an economic downturn begins. • Interventions, though, can increase the National Debt
How should we stimulate the economy?OR Should we Increase Government Spending or Cut Taxes? • Imagine the government decided to increase the pay of Professor Berri (because he is so wonderful). This is an increase in government spending. • Imagine the government decided to cut the taxes of Professor Berri (because he is so wonderful). This is a decrease in taxes. • Both policies put more money in Professor Berri’s pocket. And if that money is spent, both policies will stimulate the economy(so if you like tax cuts, you should like increases in government spending). • When does government want to stimulate the economy? • What happens if the government keeps trying to stimulate the economy?
What is the impact of government borrowing on an economy at full-employment? • If an economy is at full-employment (and we are not at the moment), then a large national debt crowds out private investment. • This increases interest rates and depresses the economy. • Hence, we don’t want the government borrowing large sums of money forever. • Yes, as the economy grows, debt doesn’t matter. But if the government is borrowing large sums in a fully employed economy, you won’t stay fully employed for longbecause higher interest rates will depress the economy. • In sum, government debt can have adverse consequences. But it is not the case that it will destroy the nation. • So DON’T PANIC!!!
Two last observations • Markets are willing to “give” the U.S. government money for free • Debt in the long-run is driven by one specific item in the national budget
How markets evaluate U.S. Debt • from Ezra Klein… “The “yield” on Treasury debt is how much the government pays to borrow money. The “real yield” is how much it pays to borrow money after accounting for inflation. When the “real yield” turns negative, it means the government isn’t paying to borrow money anymore. Rather, the situation has flipped, and the government is getting paid to keep money safe.” • When the current real yield is negative, markets are saying that government debt is willing to give money to the government for free. • Why would they do this?
http://www.treasury.gov/resource-center/data-chart-center/interest-rates/Pages/TextView.aspx?data=realyieldhttp://www.treasury.gov/resource-center/data-chart-center/interest-rates/Pages/TextView.aspx?data=realyield Daily Treasury Real Yield Curve Rates
Forecasting the Future? • The primary factor influencing our projections of the National Debt is healthcare. • What will be the cost of health care in 30 years? To answer this question, we need to forecast technology. • In other words, we probably shouldn’t just assume costs will continue to rise as costs have risen in the past.
Politicians and the National Debt • Imagine we think the National Debt is a huge problem. • How can this be lowered? • We could focus on revenue: So we can raise taxes. Taxes on the richest have been much higher in the past without any observable impact on economic growth rates. • We could focus on costs: Federal government primarily spends money on • National Defense • Social Security • Medicare • Do people who focus on the debt typically discuss ALL options? Or do they focus on only one or two aspects of the budget?