Download
1 / 9
221 likes | 1.06k Views
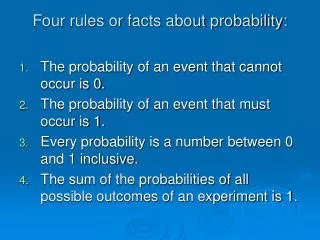
Chapter 5: Probability Distribution. What is Probability Distribution? It is a table of possible outcomes of an experiment and the probability of each outcome. It describes the chance of the future event The probability of each outcome is between 0 and 1

E N D
Chapter 5: Probability Distribution What is Probability Distribution? • It is a table of possible outcomes of an experiment and the probability of each outcome. • It describes the chance of the future event • The probability of each outcome is between 0 and 1 • The sum of all mutually exclusive possible outcomes is 1. Example: In tossing a coin two times, the possible outcomes can written in the table below:
Suppose we are interested in the number of the heads showing face up. The table above can be modified to:
The graph of the number of heads resulting from tossing one coin two times.
The mean, and Standard Deviation of a Probability Distribution The mean is the weighted average of the probability distribution. It represents the typical value used to summarize the probability distribution. The mean can be called expected value, E(x). The mean of the probability distribution can be expressed in the following formula: μ=E(x)= ∑[xp(x)] where x is the random variable, and p(x) is the probability of x.
Note: A random variable is a variable can assume different random values. In tossing a coin, if x is the variable that can assume different outcomes such as 1 head, 1 tail, 0 head, 0 tail, x is called random variable. Standard Deviation describe the amount of spread in a probability distribution. It can be expressed by the following formula: ϭ=(∑[(x-μ)2p(x)])1/2
Example: A retail computer shop every day sells three types of internet modems—A, B, and C. They are sold for 25$, 30$, and 35$ respectively. The probability the next A modem purchase is 0.30, 0. 50 B purchase, and 0.20 C purchase. Compute the mean of the probability distribution Compute the standard deviation of the probability distribution
Solution: a. E(x)=5+15+10.5=30.5$ b. Ϭ=((25-30.5)2*0.20+(30-30.5)2*0.50+(35-30.5)2*0.30)1/2 =3.5$
Exercises The following is the probability distribution for cash prizes in a lottery conducted at CTN radio station. If you buy one ticket, what is the probability that you win at least 100,000 riel? Compute the mean and standard deviation of this distribution.