Download

1 / 17
180 likes | 337 Views
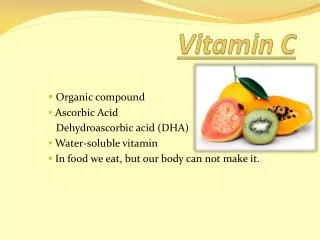
Vitamin C Titration Group Presentation. By Abby Horst Alexis Kim Cassie Hayward Disney Pitimanaaree Gage Laskowski Nikki Derosier. Question???. Is there more Vitamin C content in organic or conventional fruits and vegetables?. Method.

E N D
Vitamin C Titration Group Presentation By Abby Horst Alexis Kim Cassie Hayward Disney Pitimanaaree Gage Laskowski Nikki Derosier
Question??? Is there more Vitamin C content in organic or conventional fruits and vegetables?
Method Step 1: We chose two fruits (strawberries and oranges) and two vegetables (cauliflower and green peppers) to extract the juices from to observe the Vitamin C content in organic vs. conventional produce.
Method Step 2: We split into two groups. One group took the organic produce and the other group took conventional produce. The produce was peeled and cut, so that the total weight added up to 250 grams. Only the part of the produce that is typically eaten was used.
Method Step 3: The 250 grams of produce was placed into a blender.
Method Step 4: The contents of the blender was then passed through a filter (cheesecloth), into a large beaker. Once most of the liquid had drained through, the cheesecloth was balled up then squeezed by an experimenter (who was wearing gloves) to ensure all of the liquid was collected.
Method Step 5: The liquid in the beaker was then passed through the same cheesecloth into a different beaker, where the cheesecloth was balled up again, and squeezed again. The pulp left in the cloth was put into the first beaker.
Method Step 6: That beaker, with the pulp, had a measured amount of water added, (the amount of water varied between different produce, but consistent between inorganic and organic produce trials). Then this beaker sat for five minutes to allow for final vitamin C extraction from the pulp.
Method Step 7: After five minutes, the pulp and water in the beaker was filtered through the cheesecloth and squeezed into the collection beaker with the rest of the sample. And the remaining pulp was thrown in the garbage.
Method Step 8: The beaker containing the collected liquid was then poured into a 500 mL cylinder, where its total volume was brought up to the same, even number amount for both organic and conventional samples with distilled water. We had a range of 250 mL-500 mL.
Method Step 9:The liquid was then poured into a large Erlenmeyer flask to be swirled to ensure even Vitamin C concentration throughout the sample.
Method Step 10: Then a 10 mL sample of the juiced produce was put into a small (250 mL or less) flask, where it was mixed with 20 mL of distilled water, 2 drops of hydrochloric acid, and 15 drops of starch solution.
Method Step 11: The sample was then titrated with Iodine, until it turned blue (grayish, light blue). There were eight titrations done for each juiced sample. The highest and the lowest amounts of iodine required to turn the solutions color blue, were removed from the data set.
Vitamin C (mg) per 10 mL Juice Sample in Organic vs. Conventional Produce Average Percent Difference: 26.16%
What the P-Value Means •The concentration of vitamin C content between strawberries is statistically the same. •Organic oranges have more vitamin C content than conventional oranges. •The concentration of vitamin C for cauliflower is greater for organic than conventional. •Organic Green peppers have more vitamin C than conventional peppers We used a T-Test in Excel to find the P-Value
Conclusion We learned that organic fruits and vegetables generally had a higher Vitamin C content (an average percent difference of 26.16%) than conventional fruits and vegetables. Three of the four produce we tested were statistically proven to have a higher Vitamin C content (11.95% for oranges, 65.78% for cauliflower, and 25.37% for green peppers), with the only exception being the strawberries.