Download
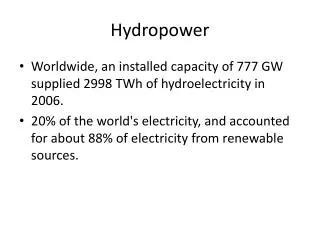
1 / 12
120 likes | 241 Views
Yellowtail Dam Modeling Results Brian Marotz Hydropower Mitigation Coordinator. Assumptions for this analysis. Optimize reservoir refill during primary use period. Avoid elevations in the Flood Pool above 3640. Reduce the extent and duration of spill (>8 kcfs).

E N D
Yellowtail Dam Modeling Results Brian Marotz Hydropower Mitigation Coordinator
Assumptions for this analysis • Optimize reservoir refill during primary use period. • Avoid elevations in the Flood Pool above 3640. • Reduce the extent and duration of spill (>8 kcfs). • Reservoir draft targets for each month, January through June, were based on water supply (April through July inflow volume). • Dam discharges during fall based on similar wateryears and shaped to provide stable fisheries flows for primary river species.
Monthly Elevation Targets Based on Inflow Water Supply
Comparison of Rule Curves and Historic Operations • Rule curves reduced reservoir drawdown in all except the highest water years. • Minimized the use of the flood pool, extent and duration. • Spill was reduced in volume and duration. On. • Bighorn River discharges remained more stable. • Extremely low river flows (<1,500 cfs) were avoided.
Next step: Compare model results and optimize benefits.