Download
1 / 25
250 likes | 255 Views
An innovative management tool that helps life insurance companies track and monitor claim payouts, identify risk points, and make underwriting, reserving, and pricing changes accordingly.

E N D
Developing A Claims Tracking And Monitoring Process Shuang Yin, Ph.D. Student at the Department of Statistics Tongan Liu, Masters Student at the Department of Mathematics 09/15/2017
Claims Tracking and Monitoring Process • An innovative management tool for life insurance companies. • The insurer can quickly grasp the notion of which types of policyholders (clusters) have required more (or less) claim payouts than expected from the insurer. Cluster Tracking & Monitoring Insurance company
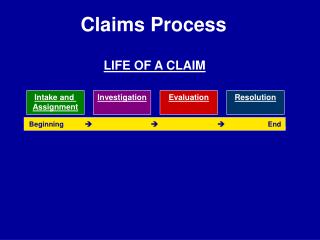
What is a Tracking & Monitoring Process • Main features of our algorithm: Efficient, Dynamic and • Flexible. • Efficient: Balance between efficiency and accuracy compared to the exhaustive method. • Dynamic: Does both the current quarter and the historical trend analysis, so management gets the information about the historical performance of a given cluster of policyholders. • Flexible: Historical trend could be tailored to suit the needs of management: we could trace the data back to 24 quarters, 36 quarters etc. • Potential of the algorithm: • Action Steps: Management could make underwriting, reserving and pricing changes accordingly for a company. • Risk control: The claims tracking tool would help management quickly identify where the risk points are and reduce the volatility of the company (good for rating analysts).
The Process of Cluster Tracking & Monitoring Warning sign on current quarter Warning sign on historical performance
Cluster Analysis (Defined By Clients) Female & Term Two-level clusters Male & Nonsmoker Male & Nonsmoker & VL Three-level clusters Male & Smoker & UL
Terminology What is A/E by amount and by count? • A/E by amount = . • A/E by count = .
Terminology Historical Performance • What is “significance”? • Statisticallysignificant is the likelihood that a relationship between two or more variables is caused by something other than random chance. • Current Quarter Slope significantly > 0 and historical average A/E significantly > 1 Significantly good Slope significantly < 0 and historical average A/E significantly > 1 Historical trend line T-test Slope significantly > 0 and historical average A/E significantly < 1 Significantly bad Clusters Z-test Slope significantly < 0 and historical average A/E significantly < 1 Not significant Not significant
Example: Management Report—Part 1 (Overall) Overall A/E is tested to be not significant. The mortality expected values were calculated based on 2014 VBT
Example: Management Report—Part 2 (Analysis of Significant Clusters)
Example: Management Report—Part 3 (Historical Trend Line For Significant Main Cluster B5 For Short Term and Long Term Trend)
Example: Management Report—Part 3 (Historical Trend Line For Significant Two-level Cluster A1 & E1 For Short Term and Long Term Trend)
What Is A Benchmarking Report • Asisshowninpreviouspages,weareabletocreate amanagementreport,forcurrentquarterA/E andhistoricaltrendlines. • Inthefuture,our purpose is to build individual reportsformultiplecompaniesand rank a company’s A/E relative to its peers. • An individual claims tracking report together with a benchmarking report will help a company understand its own claim experience as well as compare it relative to its peers.
ConcludingComments And Next Steps • Individual company claims tracking and monitoring report could use a company’s own expected mortality for A/E analysis. • Benchmarking report should use the same expected mortality for all companies in order to be comparable. • Goldenson Center plans to partner with a third party in order to develop an industry-wide quarterly claims tracking, monitoring and benchmarking system. • Use of a third party ensures company privacy and data confidentiality. • Valuable experiential education for Goldenson Center students. • Valuable information for participating companies. • Could be extended to other actuarial risks like long term care, disability income, variable annuity partial withdrawals, etc.
Cluster Z-test Cluster Z-test (by amount) • : Expected payout of policies. • : Actual payout of policies, • Cluster = , • Test statistics: Z-score = ~ N(0,1) • Hypothesis: E(Cluser) = 1 vs E(Cluster) ≠ 1 • Decision criteria: reject Expected( Cluster )= 1 if p-value = Probability (z > |Z-score|) < 0.05. • Standard Deviation formula: • : Face amount value of policy number k • : Mortality rate of the policyholder, aged x, also notated as • SD(Cluster) = • Variance(Cluster) = =
Slope T-test T-test for Trend Line Slope • Construct a simple linear model: • y is the estimate value of A/E, and x is the number of quarters from the starting point. • Hypothesis: = 0 vs ≠ 0 • Test statistic: T-score = ~ t-distribution • Decision criteria: reject = 0 if p-value = Probability (t > |T-score|) < 0.05. T-test for Historical Average A/E • Hypothesis: = 1 vs ≠ 1 • Test statistic: T-score = ~ t-distribution • Decision criteria: reject = 1 if p-value = Probability (t > |T-score|) < 0.05.
Second-to-Die Policy Mortality Rate Formula • Second-to-Die mortality rate = Probability{2nd death occurs in the coming year given that at least one life is alive at the beginning of the year} =