Download
1 / 22
240 likes | 355 Views
Satellite Imagery for Monitoring Offshore Oil and Gas Infrastructure. John Amos – SkyTruth Shepherdstown, WV November 2006. Slick Detection. Radar satellite images a proven method for slick detection over large areas Demonstrated for both human-caused and natural oil slicks

E N D
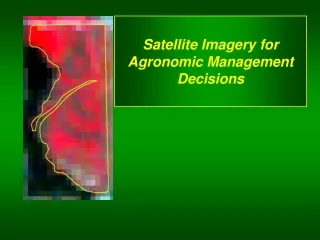
Satellite Imagery for Monitoring Offshore Oil and Gas Infrastructure John Amos – SkyTruth Shepherdstown, WV November 2006
Slick Detection • Radar satellite images a proven method for slick detection over large areas • Demonstrated for both human-caused and natural oil slicks • Routinely used as offshore exploration tool • Routinely used for offshore pollution monitoring (UK, Norway, Canada)
Slick Detection Gulf of Mexico: Unoiled water (top) and schematic diagram showing good backscatter of incident radar energy. Active seep area in same region (bottom) with thin layer of floating oil. Note flattening of capillary waves. Schematic diagram illustrates poor backscatter from slick. Floating beer cans for scale. Wind speed 11 knots. SOURCE: MacDonald et al., AAPG Memoir 66, 1996
Natural Seeps 10 km Slicks formed above natural seafloor oil seeps, GoM
Prestige sinking off NW Spain November 17, 2002
Pipeline Leak RADARSAT image of oil slick (red highlight), South Pass. Pipeline rupture followed hurricane in October 1998.
Gulf Monitoring (proposed) RADARSAT-1 Image Collection Modes
Gulf Monitoring (proposed) ScanSAR-Narrow acquisition program (4 scenes)
Gulf Monitoring (proposed) Wide-mode acquisition program (4 scenes)
Gulf Monitoring (proposed) • Could use existing CSTARS facility • Based at Univ. of Miami • Currently used to monitor vessel traffic in Caribbean Basin • Can cover entire Gulf of Mexico Basin • Current research at Texas A&M to automate oil slick detection and mapping (Dr. Ian MacDonald) • Planned radar satellites will have improved capability to estimate volume
Gulf Monitoring (proposed) • Products • GIS-compatible digital files of map-rectified RADARSAT imagery • GIS database of detected slicks • GIS database of known natural seeps, shipping lanes, pipelines, platforms • Internet-distributed alerts • Google Earth-style public interface • Program Cost: $350 - $450K Annually
Gulf Monitoring (proposed) • Ancillary Applications • Severe storm follow-up • Monitoring ship traffic in sensitive areas (Flower Garden Banks marine sanctuary) • Monitoring discharge from drilling and production platforms, LOOP • Monitoring bilge discharge from ships • Detecting and tracking strong eddy currents shed from Gulf Stream