Download
1 / 19
220 likes | 260 Views
Satellite Meteorology Basics. Scott Lindstrom and Hank Revercomb SSEC Tim Schmit NOAA NESDIS STAR Teachers Workshop Cape Canaveral, FL. 1959—Black and White Sensors:. To address the Earth Radiation Budget challenge Giving a global view of the Earth’s Climate

E N D
Satellite Meteorology Basics Scott Lindstrom and Hank Revercomb SSEC Tim Schmit NOAA NESDIS STAR Teachers Workshop Cape Canaveral, FL
1959—Black and White Sensors: • To address the Earth Radiation Budget challenge • Giving a global view of the Earth’s Climate • Black & White to separate Solar and IR contributions(Black = Solar + IR ; White = IR with little Solar) Inspired by 1953 thesis:“The Heat Budget over a corn field” 2
13 Oct 1959-Feb 1960 Explorer 7 measured the Earth Radiation Balance The 1st meteorological satellite instrument to observe the Earth • Radiometer designed by Verner Suomi & Robert Parent • Omni-directional spheres • 3-color (black, white, gold) Spheres also onTIROS 3, 4, 71961-63 3
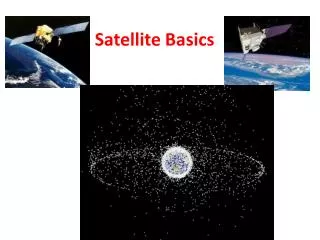
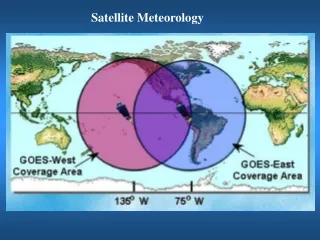
Two kinds of orbits Not to scale!
Two kinds of orbits This is one day’s worth of satellite passes (for Terra – a polar-orbiter)
Geo (rapid refresh) vs LEO (full earth coverage)
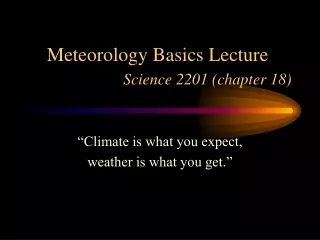
Spectral Bands • Visible band • Cloud cover and surface features • During the day • Infrared band • Surface or cloud-top temperature • Day and Night • Water vapor band • Upper-level water vapor • Day and Night
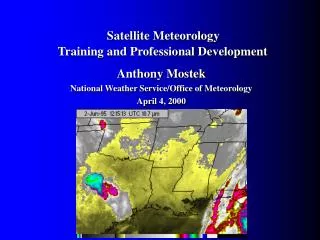
In these images – satellite is identified, and wavelength, and day and time (UTC)
This is a Visible Image : White regions are maxima in solar reflectance This shows reflected light Albedo is highest in white regions: Clouds, Snow, Sand
This is an Infrared Image : White regions are minima in earth-emitted radiation This shows emitted energy Cold regions white; warm regions dark
Infrared In both of these images, you can detect the land-sea difference 10.7 mm Visible Conclusion: the atmosphere is mostly transparent to radiation at these wavelengths 0.63 mm
This image is from the same time – but at a different wavelength 6.7 mm…Notice that you cannot see the surface. Why?
This image is from the same time – but at a different wavelength 6.7 mm…Notice that you cannot see the surface. Why? Surface radiation at this wavelength is absorbed by the atmosphere
Satellite Data Sources • http://cimss.ssec.wisc.edu/goes/shortcourse/teachers2016.html#imagery • A variety of geostationary satellites and other info • http://www.ssec.wisc.edu/data/ • A link to a variety geostationary and polar orbiting satellites • http://ge.ssec.wisc.edu/modis-today/ • True-color MODIS Imagery over the USA, created daily • http://www.aos.wisc.edu/weather/wx_obs/Satellite.html • US- and Wisconsin-centric imagery and animations
Suomi NPP(National Polar Partnership) On 25 January2012 NASA & NOAA renamed their newest Earth-observing satellite after UW-Madison space pioneer 19 NPP VIIRS Image, GSFC