Download
1 / 123
1.23k likes | 1.47k Views
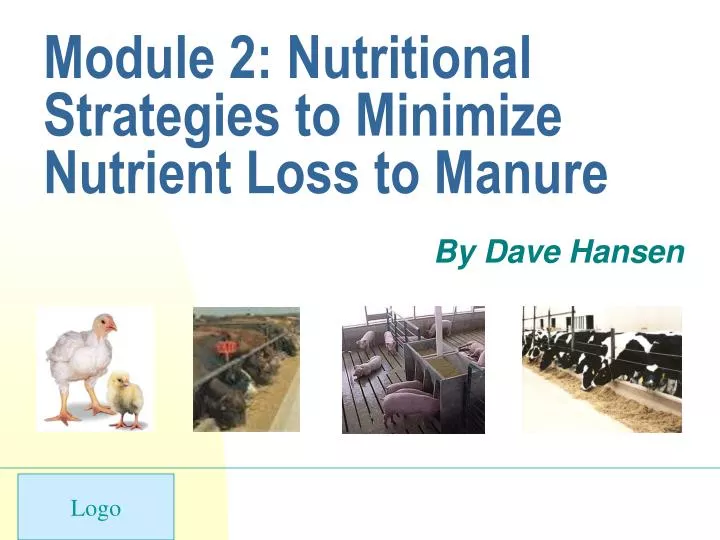
Module 2: Nutritional Strategies to Minimize Nutrient Loss to Manure. By Dave Hansen. Goal. The goal of this module is to help producers maximize nutrient utilization on their animal operations while avoiding waste and overfeeding. . Objectives.

E N D
Module 2: Nutritional Strategies to Minimize Nutrient Loss to Manure By Dave Hansen
Goal The goal of this module is to help producers maximize nutrient utilizationon their animal operations while avoiding waste and overfeeding. Certified Nutrient Management Planning
Objectives • The main objectives of this module are to provide information to CAFO Owner/Operators regarding: • Basic concepts in animal nutrition. • How to improve nutrient yield. • Techniques for reducing ammonia loss. • Economic considerations when reducing nitrogen (N) and phosphorus (P) excretion. Certified Nutrient Management Planning
Contents • Basic nutrient cycling in animal systems • National Research Council (NRC) guidelines • Dietary strategies to improve nutrient efficiency • Dairy • Beef • Swine • Poultry Certified Nutrient Management Planning
Basic Nutrient Cycling • The idea is the same regardless of animal (or bird) type: to provide adequate nutrients while minimizing waste. • Providing nutrients in excess of animal requirements results in increased costs of production and contributes to potential environmental problems. Certified Nutrient Management Planning
Feed provided Waste Feed waste Feed consumed Inefficiencies Intestinal secretions (enzymes, cells) Undigested feed and secretions Nutrients absorbed Maintenance Nutrients available for growth Mismatch Nutrients used for growth Inefficiencies Growth Basic Nutrient Cycling (continued) Inefficiencies can be caused by a variety of factors including housing conditions, management, genetics, and feed quality. Nutrient paths in animal feeding operations. Source: van Heugten and van Kempen 2000 Certified Nutrient Management Planning
Nutrient Flow in an Animal Operation Certified Nutrient Management Planning
Basic Nutrient Cycling Nitrogen and P present different challenges. Improving the efficiency of N use often includes changes in the source of N, such as improving forage quality or supplementing with amino acids. Improving the efficiency of P use often includes reducing unnecessary additions of supplemental P (as with ruminants) or increasing the availability of dietary P through such techniques as adding phytase (as with swine and poultry). Certified Nutrient Management Planning
NRC Guidelines In 1916 the National Academy of Sciences organized the NRC to “…associate the broad community of science and technology with the Academy’s purposes of furthering knowledge and advising the federal government.” The various subcommittees address animal nutrition issues and develop guidelines for each animal type. Certified Nutrient Management Planning
NRC Guidelines (continued) These guidelines are updated periodically to incorporate new information. The following tables are for dairy, beef cattle, swine, and poultry. Certified Nutrient Management Planning
NRC Guidelines: Dairy Certified Nutrient Management Planning
Body Weight, lb. 525 650 775 900 1025 1150 Dry Matter Intake, lb/d 14 17 19.5 21.5 23.5 25.5 Daily Gain, lb. Crude Protein, lb/d 1.0 1.22 1.36 1.49 1.57 1.65 1.72 1.8 1.55 1.69 1.82 1.86 1.91 1.95 2.5 1.87 2.01 2.13 2.14 2.15 2.16 3.3 2.18 2.32 2.43 2.40 2.38 2.36 4.0 2.49 2.62 2.73 2.66 2.60 2.54 Calcium, lb/d 1.0 0.04 0.04 0.05 0.05 0.00 0.05 1.8 0.06 0.06 0.06 0.06 0.06 0.06 2.5 0.08 0.08 0.08 0.07 0.07 0.07 3.3 0.10 0.09 0.09 0.09 0.08 0.08 4.0 0.11 0.11 0.10 0.10 0.09 0.09 Phosphorus, lb/d 1.0 0.02 0.02 0.03 0.03 0.03 0.03 1.8 0.03 0.03 0.03 0.03 0.04 0.04 2.5 0.04 0.04 0.04 0.04 0.04 0.04 3.3 0 .04 0.04 0.04 0.05 0.05 0.05 4.0 0.05 0.05 0.05 0.05 0.05 0.05 NRC Guidelines: Beef, Finishing Certified Nutrient Management Planning
Protein, Ca, and P requirements for beef cows Months Since Body DM CP Calving Weight Intake Ca P lb . lb. ------------------ lb/d ------------------ 0 (Calving) 1,340 24.6 2.20 0.06 0.04 1 1,200 26.8 2.71 0.08 0.05 2 (Peak Milk) 1,200 27.8 2.97 0.09 0.06 3 1,205 28.4 2.82 0.08 0.06 4 1,205 27.4 2.54 0.07 0.05 5 1,205 26.5 2.26 0.06 0.04 6 1,210 25.7 2.04 0.06 0.04 7 (Weaning) 1,215 24.2 1.45 0.04 0.03 8 1,225 24.1 1.49 0.04 0.03 9 1,240 24.0 1.57 0.04 0.03 10 1,260 23.9 1.69 0.06 0.04 11 1,290 24.1 1.89 0.06 0.04 NRC Guidelines: Beef, Cows Certified Nutrient Management Planning
Nutrient Pig Weight Pig Weight Pig Weight Pig Weight Pig Weight Pig Weight 3 - 5 kg 5 - 10 kg 10 - 20 kg 20 - 50 kg 50 - 80 kg 80 - 120 kg (176-265 lb) (7 - 11 lb) (11-22 lb) (22-44 lb (44-110 lb) (110-176 lb) Crude Protein, % 26.0 23.7 20.9 18.0 15.5 13.2 Lysine, % total 1.5 1.35 1.15 0.95 0.75 0.60 Lysine, % appt. ileal dig 1.26 1.11 0.94 0.77 0.61 0.47 Calcium, % 0.90 0.80 0.70 0.60 0.50 0.45 P, % total 0.70 0.65 0.60 0.50 0.45 0.40 P, % avail. 0.55 0.40 0.32 0.23 0.19 0.15 Potassium, % 0.30 0.28 0.26 0.23 0.19 0.17 Sodium, % 0.25 0.20 0.15 0.10 0.10 0.10 Copper, mg 6 6 5 4 3.5 3 Zinc, mg 100 100 80 60 50 50 NRC Guidelines: Swine Certified Nutrient Management Planning
NRC Guidelines: Poultry-Chickens a Grams feed intake/hen daily b Based on dietary metabolizable energy concentration of approximately 2,900 kcal/kg (1,318 kcal/lb) and an assumed 90% egg production rate (90 eggs daily per 100 hens). c Phosphorus is nPP. 1Adapted from Tables 2-3, 2-6, 3-1, 5-1. Nutrient Requirements of Poultry, 9th Revised Edition, 1994. National Research Council. Certified Nutrient Management Planning
NRC Guidelines: Poultry-Turkeys a Grams feed intake/hen daily b Based on dietary metabolizable energy concentration of approximately 2,900 kcal/kg (1,318 kcal/lb) and an assumed 90% egg production rate (90 eggs daily per 100 hens). c Phosphorus is nPP. 1Adapted from Tables 2-3, 2-6, 3-1, 5-1. Nutrient Requirements of Poultry, 9th Revised Edition, 1994. National Research Council. Certified Nutrient Management Planning
NRC Guidelines: Poultry-Other a Grams feed intake/hen daily b Based on dietary metabolizable energy concentration of approximately 2,900 kcal/kg (1,318 kcal/lb) and an assumed 90% egg production rate (90 eggs/100 hens daily). c Phosphorus is nPP. 1Adapted from Tables 2-3, 2-6, 3-1, 5-1. Nutrient Requirements of Poultry, 9th Revised Edition, 1994. National Research Council. Certified Nutrient Management Planning
Feed Waste • Poor feeder design, poor feeder management, and spoilage during storage can lead to losses as great as 20%. • Example: Swine “rooting” through feed can cause 3.4% waste. • Example: Feed costs account for as much as 70% of the cost of raising poultry–a little waste means big $$. Certified Nutrient Management Planning
Dietary Strategies to Improve Nutrient Efficiency Certified Nutrient Management Planning
Strategies for Dairy Producers • Properly formulate rations to • Optimize milk yield. • Minimize N, P, and potassium excretion in urine/manure. Certified Nutrient Management Planning
Strategies for Dairy Producers (continued) • Precisely meet requirements for • Milk production. • Maintenance. • Gestation. Certified Nutrient Management Planning
Understand nutrient INPUTS, OUTPUTS, and % of nutrients that remain on the farm or that are lost to the environment. • Assess your nutrient balance. This allows you to determine management options that increase the recycling of nutrients from cropland to cattle and back to crops again. Key Concepts of Nutrient Balance on a Dairy Farm Certified Nutrient Management Planning
Key Concepts of Nutrient Balance on a Dairy Farm (continued) • The percentage of dietary N and P that remain on the dairy farm can be as high as 76% and 81% (respectively). • Point: Profitable milk production includes both milk productivity and efficiency of nutrient utilization. Certified Nutrient Management Planning
Nitrogen Strategies for Dairy • Increase dry matter uptake. • Improve forage quality. • Consider forage protein fraction. • Consider feeding method. • Consider supplemental protein source. • Monitor blood urea nitrogen (BUN) and milk urea nitrogen (MUN). Certified Nutrient Management Planning
Size of Dairy, Number of Cows* 45 320 500 Input -----(tons of N per year)----- Purchased fertilizer 1.0 13.5 26.1 Purchased feed 3.8 43.8 78.5 N fixation by legumes 1.3 14.6 13.9 Purchased cattle 0 0.1 0 Total inputs 6.1 72.0 118.5 Output Milk 2.0 18.6 26.4 Cattle sold 0.1 1.9 1.9 Crops sold .01 0 0 Total Outputs 2.2 20.5 28.3 Remainder 3.9 51.5 90.2 % Remaining on farm 64% 71% 76% Nitrogen Balance Table Mass N balance for New York dairy farms. Source: Klausner 1993 Certified Nutrient Management Planning
A Few Terms and Definitions • Crude protein (CP) = N x 6.25 • Rumen degradable protein (RDP) = CP that is degraded in the rumen; required by bacteria to grow • Rumen undegradable protein (RUP) = “escape or bypass” CP that is NOT degraded in rumen but passes to lower tract Certified Nutrient Management Planning
Increase Dry Matter Uptake • The percentage of CP required to supply adequate protein for milk production varies with intake level. • Increasing dry matter intake by 5% reduces the CP needed by about 1%. • Higher intake levels also increase microbial protein synthesis in the rumen. • Increasing intake level, then, can decrease the need for higher dietary protein. Certified Nutrient Management Planning
Improve Forage Quality • “High-quality” forage contains more protein, less fiber, and more energy, resulting in more protein and digestible dry matter for the animals, which can help reduce the amount of N inputs from off-farm sources. Certified Nutrient Management Planning
Forage Protein Fractions • Supplementing a highly degradable (e.g., legume silage) forage with a less degradable forage (e.g., corn silage) can improve milk production at lower CP levels. • Common supplemental RUP sources include blood meal, distillers grains, and soybeans. Certified Nutrient Management Planning
Feeding Method • Feeding sequence, frequency, and grouping strategy can impact N utilization. • Lactating cows require a proper balance of RUP and RDP to meet requirements for metabolizable protein (MP). • MP is the protein that the cow actually absorbs and uses for production. Certified Nutrient Management Planning
Feeding Method (continued) • Requirement for RUP = 35% to 38% of CP • Requirement for RDP = 62% to 65% of CP • A study by Van Horn (1992) showed the impact of considering RUP and RDP. • The lactating cows fed the proper amount of RUP to supplement RDP generated 223 pounds of N per year in manure. Certified Nutrient Management Planning
Feeding Method (continued) • The cows fed simply to satisfy Total CP (i.e., a higher percentage of RUP) generated 260 pounds of N per year in manure. Certified Nutrient Management Planning
Monitor BUN and MUN • The MUN test • > 18 mg/dl indicates that too much protein is being fed or there is not enough dietary starch. • High MUN is related to • Lower reproductive performance. • Higher feed costs. • Health problems. • Poorer milk production. Certified Nutrient Management Planning
Monitor BUN and MUN (continued) • MUN analyses can be used to signal potential problems with feeding programs. Certified Nutrient Management Planning
Phosphorus Strategies for Dairy • Phosphorus is an expensive supplement. • Most commercial mixes include P. • Current guidelines specify 0.32% to 0.42% P for lactating cows. • It is common for producers to feed as much as 0.60% P. • Numerous studies show no production benefit from these high levels of P! Certified Nutrient Management Planning
Size of Dairy, Number of Cows* 45 320 500 Input -----(tons of P per year)----- Purchased fertilizer 1.2 2.0 5.5 Purchased feed 1.0 8.4 14.2 0 0.03 0 Total inputs 2.2 10.4 24.2 Output Milk 0.36 3.8 5.5 Cattle sold 0.05 0.5 0.5 Crops sold 0.01 0 0 Total Outputs 0.43 4.3 6.0 Remainder 1.8 6.2 18.2 % Remaining on farm 81% 59% 75% Phosphorus Balance Mass P balance for New York dairy farms Source: Klausner 1993 Certified Nutrient Management Planning
P excretion (lb) 70 60 50 40 30 20 10 0 0.4 0.5 0.6 Effect of P Intake on P Excretion • Increasing P content from 0.40% to 0.60% of diet dry matter increases P output from 40 to 69 lbs/cow/year! Certified Nutrient Management Planning
Sources of P • High availability • Monocalcium phosphate • Dicalcium phosphate • Monosodium or ammonium phosphate • Medium availability • Steamed bone meal • Sodium tripolyphosphate Certified Nutrient Management Planning
Sources of P (continued) • Low availability • Low-fluorine rock phosphate • Soft rock phosphate Certified Nutrient Management Planning
Phytate P • Phytate-P is not readily available to non-ruminants such as swine. • However, rumen microbes produce phytase. • Releases P from phytate • So, phytate-P is available to ruminants. • And, it is not necessary to over-supplement P above requirements. Certified Nutrient Management Planning
Feeding Excess P Costs $$$ • P is the most expensive mineral commonly supplemented in dairy cows. • Example: A diet containing 0.45% P vs. a diet containing 0.55% P would save about $0.05 per cow daily. • For 100 cows a year, that is $1,825. Certified Nutrient Management Planning
Feeding P: The Bottom Line • The milking herd should be grouped by production level so that multiple rations can be formulated over the complete lactation. Certified Nutrient Management Planning
The Bottom Line for Dairies • Are high milk yield and minimal nutrient excretion mutually exclusive? • No, you can do both! • Focus on • Testing all forages/feeds. • Properly formulating rations. • Maximizing feed intake. • Cow comfort and proper grouping. Certified Nutrient Management Planning
Strategies for Beef Cattle • Develop a general understanding of N (protein) and P metabolism in feedlot cattle. • Understand current methods for decreasing N and P excretion by manipulating beef feedlot diets • P requirements • Protein requirements Certified Nutrient Management Planning
Nitrogen Management • Discuss protein requirements • Impact of lowering dietary N Certified Nutrient Management Planning
Dietary Protein Theory for lowering protein • All excess protein above requirements have no value. • Excess protein is absorbed in the small intestine. • Protein is de-animated in the liver. • Urea is subsequently excreted in urine at the kidney. Certified Nutrient Management Planning
Dietary Protein (continued) • Urea is rapidly converted to ammonia following deposition. Therefore, • Feeding less protein leads to less urea excretion. • Lower urea excretion should decrease ammonia. Certified Nutrient Management Planning
Dietary Protein (continued) CP system • Assumes all proteins are equal. • Important point: protein is N • % N * 6.25, protein is ~16% N • Does not account for bacterial needs. • Is simple but incorrect! Certified Nutrient Management Planning
Protein Requirements MP system • DIP * TDN * microbe efficiency = BCP (degradable N and energy) • Efficiency dependent on rumen pH, ~8-8.5 • BCP*.64 to determine protein at S.I. • UIP * .80 to estimate protein at S.I. • BCP + UIP = MP Certified Nutrient Management Planning
MP system Rumen Feed protein urea, corn protein UIP DIP DIP Small Intestine MP BCP BCP NH3 + carbon = microbial protein (BCP) Protein Requirements (continued) Certified Nutrient Management Planning