Download

1 / 25
330 likes | 1.25k Views
Chi-square test or c 2 test. Chi-square test. Used to test the counts of categorical data Three types Goodness of fit Independence Homogeneity. c 2 distribution –. df=3. df=5. df=10. c 2 distribution. Different df have different curves Skewed right Only positive values

E N D
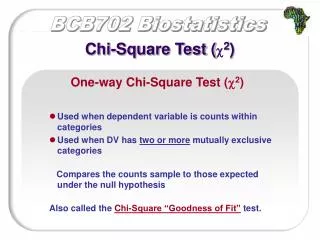
Chi-square test • Used to test the counts of categorical data • Three types • Goodness of fit • Independence • Homogeneity
c2 distribution – df=3 df=5 df=10
c2 distribution • Different df have different curves • Skewed right • Only positive values • As df increases, curve shifts toward right & becomes more like a normal curve
c2 Goodness of fit test • Want to see how well the observedcounts “fit” what we expect the counts to be
c2 Goodness of fit test Explain the parameters. State the Hypotheses Null Hypothesis: H0: p1 = hypothesized proportion for category 1 and p2 = hypothesized proportion for category 2 and … i.e. The actual population distribution is equal to the expected distribution. Alternative Hypothesis: Ha: H0 is not true. i.e. The actual population distribution is different from the expected distribution. Conditions: 1. Observed cell counts are based on a random sample. 2. The sample size is large. The sample size is large enough for the chi-squared test to be appropriate as long as every expected count is at least 5.
c2 Goodness of fit test Test Statistic: Degrees of freedom = Number of categories -1 Write the decision and conclusion.
c2 Goodness of fit test Example Last year, at the 6pm time slot, television channels 2, 11, 13 and 26 captured the entire audience with 30%, 25%, 20% and 25% respectively. During the first week of the new season, 500 viewers are interviewed with the results below. Has the preference changed from last season? Parameters p1 = true proportion of channel 2 viewers p2 = true proportion of channel 11 viewers p3 = true proportion of channel 13 viewers p4 = true proportion of channel 26 viewers
c2 Goodness of fit test Example Last year, at the 6pm time slot, television channels 2, 11, 13 and 26 captured the entire audience with 30%, 25%, 20% and 25% respectively. During the first week of the new season, 500 viewers are interviewed with the results below. Has the preference changed from last season? Hypothesis Ho : p1 = 0.30 p2 = 0.25 p3 = 0.20 p4 = 0.25 Ha: At least one of the proportions is not as expected
c2 Goodness of fit test Example Conditions • The sample should be random which I will assume. 2) The sample size should be large. Since all expected counts are greater than 5 the sample is large enough. df = 3 p-value = = .05
c2 Goodness of fit test Example Decision Decision Since the p-value < , I reject the null hypothesis at the .05 level. Since the p-value < , I reject the null hypothesis at the .05 level. Conclusion There is evidence to conclude that the viewing preference for the 6 pm news has changed.
c2 test for independence • Used to see if the two categorical variables are associated or not associated (independent)
c2 test for independence State the Hypotheses NullHypothesis: H0: The two variables are independent (or not associated) Alternative Hypothesis: Ha: The two variables are not independent (or associated) Conditions: 1) A random sample is taken from one large population. 2) The sample size is large - all expected cell counts are at least 5 3) Each outcome can be classified into one of several categories on one variable and into one of several categories on a second variable.
c2 test for independence Test Statistic: expected cell count = df = (# of rows -1)(# of column -1) Write the decision and conclusion.
c2 test for independence A beef distributor wishes to determine whether there is a relationship between geographic region and cut of meat preferred. Suppose that, in a random sample of 500 customers, 300 are from the North and 200 from the south preferences were as in the table. Is beef preference independent of geographic region? Geographic Region Beef Preference Hypothesis Ho : Beef preference is independent of geographic region Ha: Beef preference is not independent of geographic region
c2 test for independence A beef distributor wishes to determine whether there is a relationship between geographic region and cut of meat preferred. Suppose that, in a random sample of 500 customers, 300 are from the North and 200 from the south preferences were as in the table. Is beef preference independent of geographic region? Geographic Region Remember : exp count = (90) (60) Beef Preference (165) (110) (45) (30) Conditions: 1) The sample is random which is stated in the problem. 2) The sample size should be large. All expected cell counts are at least 5 as shown in the table 3) Each outcome can be classified by region and cut.
c2 test for independence Geographic Region (90) (60) Beef Preference (165) (110) Enter observed counts in Matrix A (45) (30) df = 2 p-value = = .05
Decision Since the p-value < , I reject the null hypothesis at the .05 level. Conclusion There is evidence to conclude that beef preference is not independent of geographic region.
c2 test for homogeneity • Used to see if the two populations are the same (homogeneous) • Are the proportion of the different outcomes in one population equal to those in another population?
c2 test for homogeneity State the Hypotheses NullHypothesis: H0: The true category proportions are the same for all the populations Alternative Hypothesis: Ha: The true category proportions are not the same for all the populations Conditions: • Independent random samples of fixed sizes are taken from two or more large OR two or more treatments are randomly assigned to two or more types of available subjects 2) Each outcome falls into exactly one of several categories, with the categories being the same in all populations. 3) The sample size is large - all expected cell counts are at least 5
c2 test for homogeneity Test Statistic: expected cell count = df = (# of rows -1)(# of column -1) Write the decision and conclusion.
In July 1991 and again in April 2001, the Gallup Poll asked random samples of 1015 adults about their opinions on working parents. The table summarizes responses to the question, “Considering the needs of both parents and children, which of the following so you see as the ideal family in today’s society? Based on these results, do you think there was a change in people’s attitudes during the 10 years between these polls? Use = 0.02 Hypotheses Ho : The proportion of adults who believe which type of family is “ideal” was not different in 1991 and 2001. Ha: The proportion of adults who believe which type of family is “ideal” was different in 1991 and 2001.
In July 1991 and again in April 2001, the Gallup Poll asked random samples of 1015 adults about their opinions on working parents. The table summarizes responses to the question, “Considering the needs of both parents and children, which of the following so you see as the ideal family in today’s society? Based on these results, do you think there was a change in people’s attitudes during the 10 years between these polls? Use = 0.02 (136.5) (136.5) (259) (259) (162.5) (162.5) (406) (406) (51) (51) Conditions: • The sample should be random which is stated and independent which I will assume. 2) Each opinion falls into one type of “ideal family” category for both 1991 and 2001. 3) The sample size should be large. All expected cell counts are at least 5 as shown in the table
(136.5) (136.5) (259) (259) (162.5) (162.5) (406) (406) (51) (51) df = 4 p-value = = .02
Decision Since the p-value > , I fail to reject the null hypothesis at the .02 level. Conclusion There is not evidence to conclude that the proportion of adults who believed in what type of family is “ideal” was different in 1991 and 2001.