Download

1 / 27
270 likes | 364 Views
Register Allocation. Prof. M. Rajasekhara Babu School of Computing Science and Engineering mrajasekharababu@vit.ac.in http://www.mrajababu.com. OutLine. Re-Cap Session Objectives & Teaching Learning Material Session Plan Register Allocation using Inference theory Introduction

E N D
Register Allocation Prof. M. Rajasekhara Babu School of Computing Science and Engineering mrajasekharababu@vit.ac.in http://www.mrajababu.com
OutLine • Re-Cap • SessionObjectives & Teaching Learning Material • Session Plan • Register Allocation using Inference theory • Introduction • Live Ranges Example • Building Inference Graph • Coloring Algorithm • Assignment • References Prof.M.Rajasekhara Babu;School of Computing Science and Engineering; VIT University; Vellore-14,India
Re-Cap 1.List the rules to compute Live ranges in a Basic Block 2.What are the 2-heuristics for spilling 3. What is meant by Common Sub Expression? 4. Why do we CSE? Prof.M.Rajasekhara Babu;School of Computing Science and Engineering; VIT University; Vellore-14,India
Objectives & Teaching Learning Material • Session Objectives • To minimize the Spilling cost • To provide knowledge on Spilling over Clean Vs farthest values. • To provide the fundamentals Graph Coloring paradigm for register Allocation. • Teaching Learning Material • LCD, White board Marker, Presentation slides Prof.M.RajasekharaBabu;School of Computing Science and Engineering; VIT University; Vellore-14,India
Session Plan Prof.M.Rajasekhara Babu;School of Computing Science and Engineering; VIT University; Vellore-14,India
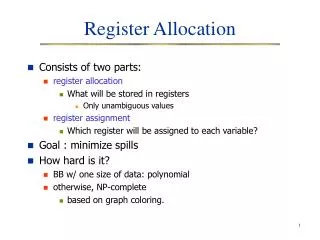
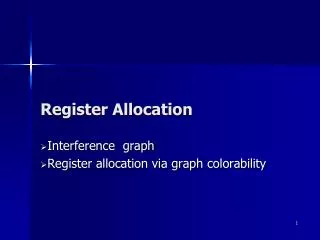
Inference • Definition: • Two values interfere if at some point in the program both are simultaneously live • Overlapped live ranges • If x and y interfere, they cannot occupy the same register • Construct interference graph GI = <N,E> • Nodes N in GI represent live ranges • Edges E in GIrepresent interferences between live ranges • For x, y N, <x,y> E iff x and y interfere • A k-coloring of GI can be mapped into an allocation to k registers Prof.M.Rajasekhara Babu;School of Computing Science and Engineering; VIT University; Vellore-14,India
Live Ranges Example live = {b,c} 1:a := b + c live = {a} 2:t1 := a * a live = {a,t1} 3:b := t1 + a live = { b,t1} 4:c := t1 * b live = {b,c} 5:t2 := c + b live = {t2,b,c} 6:a := t2 + t2 live = {a,b,c} Live ranges: [1,3], [6, exit] -- a [entry,1],[3,exit] -- b [entry,1],[4,exit] -- c [2,4] -- t1 [5,6] -- t2 In this sequence, each definition introduces a new live range: sounds familiar? Live variables that need to be propagated to next basic block (LIVEOUT) Prof.M.Rajasekhara Babu;School of Computing Science and Engineering; VIT University; Vellore-14,India
Building Interference Graphs • Algorithm to construct GI = <N,E> (EAC Fig13.7) For each live range LRi, create a node NiN For each basic block b LIVENOW = LIVEOUT(b) for each operation oi in b in reverse order, with form oi: opi LRa, LRb LRc foreach LRj in LIVENOW add(LRc, LRj) to E //interference remove LRc from LIVENOW add LRa and LRb to LIVENOW Prof.M.RajasekharaBabu;School of Computing Science and Engineering; VIT University; Vellore-14,India
a1 a2 c2 t1 b2 t2 Interference Graph Example live = {b,c} a1 := b1 + c1 live = {a} t1 := a1 * a1 live = {a,t1} b2 := t1 + a1 live = { b,t1} c2 := t1 * b2 live = {b,c} t2 := c2 + b2 live = {b,c,t2} a2 := t2 + t2 live = {a,b,c} b1 c1 Prof.M.Rajasekhara Babu;School of Computing Science and Engineering; VIT University; Vellore-14,India
Problem: A graph G is said to be k-colorable iff the nodes can be labeled with integers 1… k so that no edge in G connects two nodes with the same label K = 4 K = 3 No color for this node A 4-colorable example Determining if a graph is k-colorable is NP-complete for k>2 Prof.M.Rajasekhara Babu;School of Computing Science and Engineering; VIT University; Vellore-14,India
Chaitin’s Algorithm • Bottom-up coloring in EAC for k registers • Compute liveness information • Create interference graph G • Simplify • Pick any node n with < k neighbors, remove it along with all edges incident to it from the graph and push it onto a stack • This will lower the degree of n’s neighbors • If (G - n) can be colored with k colors, so can G • If we reduce the entire graph, goto step 5; otherwise repeat step 3 Prof.M.Rajasekhara Babu;School of Computing Science and Engineering; VIT University; Vellore-14,India
Spill • After step 3, if the graph is not empty: we get to the point where we are left with only nodes with a degree >= k • Mark some node for potential spilling, remove, back to step 3 • Assign colors • Starting with empty graph, rebuild graph by popping elements off the stack and assigning a color different from neighbors • Potential spill nodes may or may not be colorable Prof.M.Rajasekhara Babu;School of Computing Science and Engineering; VIT University; Vellore-14,India
a1 a2 c2 t1 b2 t2 • Interference graph from previous example Assume k = 3 Pick a1 Prof.M.Rajasekhara Babu;School of Computing Science and Engineering; VIT University; Vellore-14,India
a1 a2 c2 t1 b2 t2 Assume k = 3 Remove a1 Next: pick t1 a1 Prof.M.Rajasekhara Babu;School of Computing Science and Engineering; VIT University; Vellore-14,India
a1 a2 c2 t1 b2 t2 Assume k = 3 a2 t1 a1 Remove a2 Next: pick b2 Prof.M.Rajasekhara Babu;School of Computing Science and Engineering; VIT University; Vellore-14,India
a1 a2 c2 t1 b2 t2 Assume k = 3 b2 a2 t1 a1 Remove b2 Next: pick c2 Prof.M.Rajasekhara Babu;School of Computing Science and Engineering; VIT University; Vellore-14,India
a1 a2 c2 t1 b2 t2 Assume k = 3 c2 b2 a2 t1 a1 Remove c2 Prof.M.Rajasekhara Babu;School of Computing Science and Engineering; VIT University; Vellore-14,India
Assume k = 3 1: blue 2: red 3: yellow t2 c2 b2 a2 t1 a1 Pop and rebuild Prof.M.Rajasekhara Babu;School of Computing Science and Engineering; VIT University; Vellore-14,India
Assume k = 3 1: blue 2: red 3: yellow c2 b2 t2 a2 t1 a1 Pop and rebuild Prof.M.Rajasekhara Babu;School of Computing Science and Engineering; VIT University; Vellore-14,India
Assume k = 3 1: blue 2: red 3: yellow c2 b2 t2 a2 t1 a1 Pop and rebuild Prof.M.Rajasekhara Babu;School of Computing Science and Engineering; VIT University; Vellore-14,India
Assume k = 3 1: blue 2: red 3: yellow c2 b2 t2 a2 t1 a1 Pop and rebuild Prof.M.Rajasekhara Babu;School of Computing Science and Engineering; VIT University; Vellore-14,India
Assume k = 3 1: blue 2: red 3: yellow a2 c2 b2 t2 t1 a1 Pop and rebuild Prof.M.Rajasekhara Babu;School of Computing Science and Engineering; VIT University; Vellore-14,India
Assume k = 3 1: blue 2: red 3: Brown a2 c2 t1 b2 t2 Pop and rebuild a1 Prof.M.Rajasekhara Babu;School of Computing Science and Engineering; VIT University; Vellore-14,India
Assume k = 3 1: blue 2: red 3: Brown b1 c1 a2 c2 t1 b2 t2 a1 := b1 + c1 t1 := a1 * a1 b2 := t1 + a c2 := t1 * b2 t2 := c2 + b2 a2 := t2 + t2 R1 := R1 + R2 R2 := R1 * R1 R3 := R2 + R1 R2 := R2 * R3 R1 := R2 + R3 R1 := R1 + R1 Prof.M.Rajasekhara Babu;School of Computing Science and Engineering; VIT University; Vellore-14,India
Summary • Register Allocation with Spilling • Spilling Considerations • Introduction to Graph Coloring Paradigm • Live Ranges Example • Discovering Liver Ranges Prof.M.Rajasekhara Babu;School of Computing Science and Engineering; VIT University; Vellore-14,India
References • Steven Muchnick: Advanced Compiler Design and Implementation. Morgan Kaufmann, 1997 • Alfred Aho, Ravi Sethi, Jeffrey Ullman, Monica Lam: 21st Century Compilers. Addison-Wesley, 2004. Prof.M.Rajasekhara Babu;School of Computing Science and Engineering; VIT University; Vellore-14,India
References • Chaitin, “Register Allocation and Spilling via Graph Coloring”, SIGPLAN Symposium on Compiler Construction, June 1982 • Briggs, Cooper, & Torczon, “Improvements to Graph Coloring Register Allocation,” ACM TOPLAS 16(3), May, 1994. • Bernstein, Goldin, Golumbic, Krawczyk, Mansour, Nashon, & Pinter, “Spill Code Minimization Techniques for Optimizing Compilers,” Proceedings of PLDI 89, SIGPLAN Notices 24(7), July 1989. • George & Appel, “Iterated Register Coalescing,” ACM TOPLAS 18(3), May, 1996. • Bergner, Dahl, Engebretsen, & O’Keefe, “Spill Code Minimization via Interference Region Spilling,” Proceedings of PLDI 97, SIGPLAN Notices 32(6), June 1997. • Cooper, Harvey, & Torczon, “How to Build an Interference Graph,” Software–Practice and Experience, 28(4), April, 1998 Prof.M.Rajasekhara Babu;School of Computing Science and Engineering; VIT University; Vellore-14,India