Download
1 / 53
530 likes | 699 Views
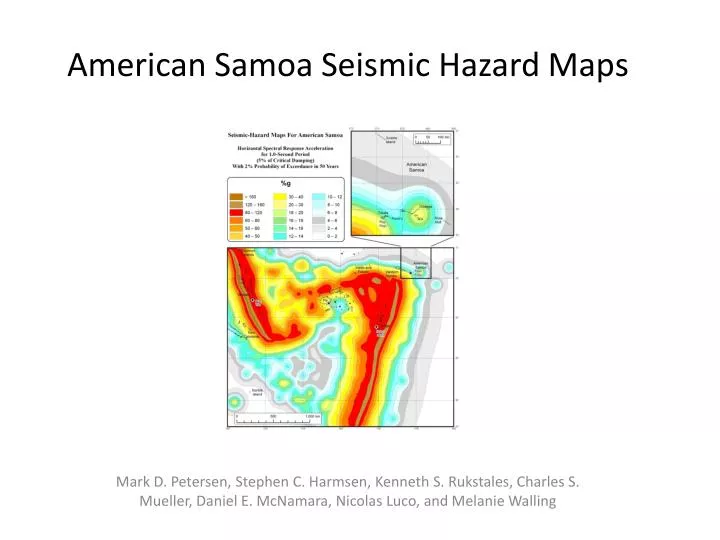
American Samoa Seismic Hazard Maps. Mark D. Petersen, Stephen C. Harmsen, Kenneth S. Rukstales, Charles S. Mueller, Daniel E. McNamara, Nicolas Luco , and Melanie Walling . American Samoa. Formed by migration of tectonic plate over hot spot 2 to 28 Ma Pacific Plate motion GPS vector

E N D
American Samoa Seismic Hazard Maps Mark D. Petersen, Stephen C. Harmsen, Kenneth S. Rukstales, Charles S. Mueller, Daniel E. McNamara, Nicolas Luco, and Melanie Walling
American Samoa • Formed by migration of tectonic plate over hot spot 2 to 28 Ma • Pacific Plate motion GPS vector • Tonga trench is one of most active subduction zones ( 15-24 cm/yr), 22 M 7 earthquakes in last 110 yrs • September, 2009 M 8.1 event on outer rise and interface
Magnitude-frequency • For this analysis we use 1964+ catalog • The rate of M 5’s seems to be higher • The rate of M 7+ is similar • Completeness near M 5
Magnitude-frequency for Tonga-Kermedec trench Model has two Mmax branches, M 8.5, 9, weighted equally
Interface and Intraplate Earthquakes Interface and Intraplate, d=25 km
Intraplate and Interface Earthquakes M 9 curves
Ground motions for Shallow crustal earthquakes(1 s and 0.2 s SA) • For M 8 crustal earthquakes Zhao is highest (less gm saturation with M) • For M 6 crustal earthquakes Zhao is lowest • In 2011 paper Zhao et al. suggests more magnitude saturation for M 7+ earthquakes.
Zhao et al. (2006) crustal, inslab, and interface earthquake ground motions • Inslab earthquakes cause high gm • Guam ground motions are dominated by • Intraslab ground motions • American Samoa ground motions are • dominated by crustal sources
Oceanic data by distance and depth Red – interface, blue – intraplate
Zhao et al. (2006) model with Pacific strong ground motion data ( 1 s and PGA)
PGA station residuals Station residuals after subtracting station term and systematic offset Residuals = data-prediction
PGA average single station residuals by magnitude and distance Residuals = data-prediction
Systematic offset of Pacific data with Zhao et al. (2006) model Total Sigma, distance ≤ 300 km, M ≥ 6.0
Logic tree In zones that include subduction zones, we use 30 percent strike-slip and 70 percent reverse in the ground-motion models. In all other zones, we use half strike-slip and half normal faulting mechanisms in the ground-motion models,
Seismic hazard map (10% PE of exceedance in 50 years for 1 s SA)
Seismic hazard map (2% PE of exceedance in 50 years for 1 s SA)
Seismic hazard map (10% PE of exceedance in 50 years for 0.2 s SA)
Seismic hazard map (2% PE of exceedance in 50 years for 0.2 s SA)
Deaggregation for Pago Pago Contribution to hazard is shown by the height from one color to the next color.