Download
1 / 14

E N D
READING MAPS DIRECTIONS & SCALES
WHAT IS A MAP? A map is a picture or representation of the Earth's surface, showing how things are related to each other by distance, direction, and size. Maps are a way of showing many things about a portion of the earth's surface on a flat piece of paper that can be carried and transported easily. A map is not a photograph of the Earth's surface. It can show many things that a picture cannot show, and as a result, a map looks different in many ways from a photograph of the Earth's surface. • Maps have been used for centuries. A person who creates map as a profession is called a cartographer.
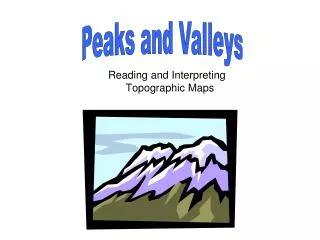
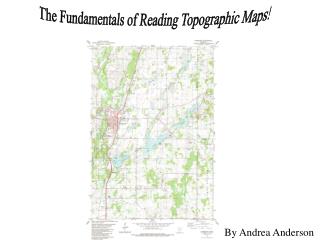
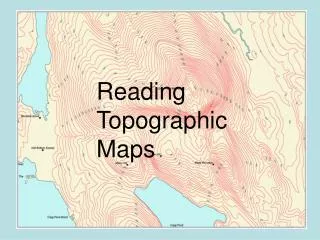
TYPES OF MAPS • Types of Maps • There are several types of maps. Each show different information. Most maps include a compass rose, which indicates which way is north, south, east and west. They also include a scale so you can estimate distances. Here’s a look at some different types of maps. • Climate maps • give general information about the climate and precipitation (rain and snow) of a region. Cartographers, or mapmakers, use colors to show different climate or precipitation zones. • Economic or resource maps • feature the type of natural resources or economic activity that dominates an area. Cartographers use symbols to show the locations of natural resources or economic activities. For example, oranges on a map of Florida tell you that oranges are grown there. • Physical maps • illustrate the physical features of an area, such as the mountains, rivers and lakes. The water is usually shown in blue. Colors are used to show relief—differences in land elevations. Green is typically used at lower elevations, and orange or brown indicate higher elevations. • Political maps • do not show physical features. Instead, they indicate state and national boundaries and capital and major cities. A capital city is usually marked with a star within a circle. • Road maps • show major—some minor highways—and roads, airports, railroad tracks, cities and other points of interest in an area. People use road maps to plan trips and for driving directions. • Topographic maps • include contour lines to show the shape and elevation of an area. Lines that are close together indicate steep terrain, and lines that are far apart indicate flat terrain.
The four cardinal directions or cardinal points are north, south, east, and west. Most commonly used for geographic orientation on Earth, they may be calculated anywhere on a rotating astronomical body. North and south point toward the poles defined by the axis of rotation. East and west orthogonallypoint along and opposite the direction of rotation. Intermediate points between the four cardinal directions form the compass rose and the points of the compass. DIRECTIONS
DIRECTIONS • South is always directly opposite north. To an observer facing north and standing upright, east and west are always to the right and left, respectively. Most devices for finding orientation thus operate by finding north first
MAP SCALES Distance and Scale A scale is a relationship of sizes. Distances on the map to distances in the real world are expressed in a ratio. Maps are usually smaller than the area they represent. Not very convenient to carry around the city map the same size as the city. Three ways to express scale. In words: I inch = 1 mile A bar scale: A ratio: 1:24,000. Although this is sometimes the most difficult one to understand, it can be the most useful. It tells us exactly how much all the measurements in the real world were "shrunk down," to fit the map. It also has no units; it’s valid whether you are measuring in inches, miles, meters, or anything else
EXAMPLES OF TYPES OF MAPS Geography Glossary
EXAMPLE OF TYPES OF MAPS • TOPOGRAPHY MAP
CREDITSTypes of Maps — FactMonster.com- 3 visits - 12:24pm There awww.factmonster.com/ipka/A0920936.htmlhis