Download
1 / 22
220 likes | 223 Views
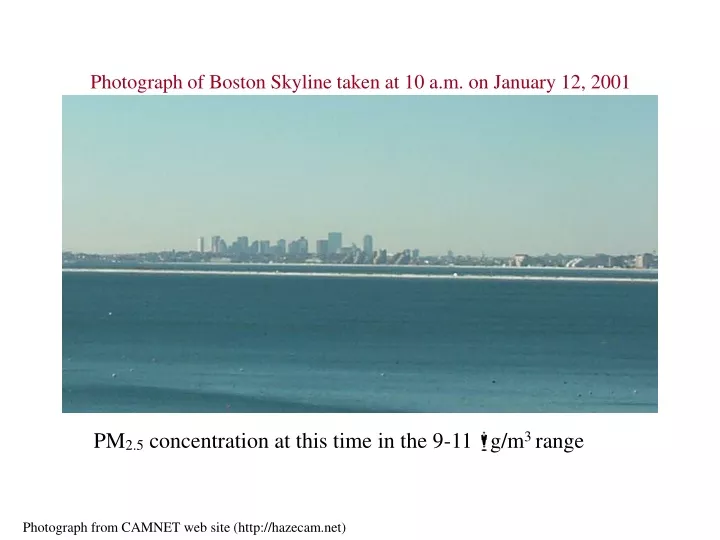
Photograph of Boston Skyline taken at 10 a.m. on January 12, 2001. PM 2.5 concentration at this time in the 9-11 g/m 3 range. Photograph from CAMNET web site (http://hazecam.net). Photograph of Boston Skyline taken at 10 a.m. on January 8, 2001.

E N D
Photograph of Boston Skyline taken at 10 a.m. on January 12, 2001 PM2.5 concentration at this time in the 9-11 g/m3range Photograph from CAMNET web site (http://hazecam.net)
Photograph of Boston Skyline taken at 10 a.m. on January 8, 2001 PM2.5 concentration at this time in the 55-65 g/m3range Photograph from CAMNET web site (http://hazecam.net)
PM10 - causes and features Speciation of particulate matter • Total acidity, tar • Nitrates, sulphates (?) • Heavy Metals (Pb, Cd, Ni, As, Hg, ...) • Poly-Aromatic Hydrocarbons (PAHs) • Nitro Poly-Aromatic Hydrocarbons • Sooth / Elemental Carbon (EC)
Origin of fine particle concentrations (PM10) measured on a busy traffic spot
Sectors contributing to ...PM10 on a busy traffic spot from all sources ...PM10 on a busy traffic spot from all sources within the city
PM10-source attribution summary(i) PM10emissions by construction contribute to more than 5% of the urban PM - background 70%of urban background PM10 can be attributed to transport sources more than half of traffic related PM10 stems from tyre abrasion and resuspended particulates, which depends on the number of vehicles • We need to tackle exhaust and non-exhaust emissions by traffic
PM10-source attribution summary(ii) • More than 1/3 of roadside PM10 - pollution can be traced back to sources outside of the Greater Berlin agglomeration • more than 40% of PM10-pollution are secondary particles • PM10-episodes are often dominated by regional/large scale transport of PM • We need a fare balance between • efforts on EU-level and • local measures when reviewing the preliminary PM-limit values for 2010
PM-source apportionment approach (i) • select monitoring sites representative for local, urban & regionalbackground • calculate PM-pollution originating with each of these scale categories • take urban (Berlin) and national (German) emissions for PM, SO2, NOx, VOC and NH4 per sector for attributing pollution of urbanbackground and regional background origin, respectively • distribute PM emissions among EC (elemental carbon), OC (organic carbon)- components and “rest” • attach VOC-related ‘component’ to OC
PM-source apportionment approach (ii) • apply weighting factors to “resuspension” and high sources, so as to account for different dispersion characteristic • calculate each sector’s percentage share on the total emissions • for measured PM-components originating in urban & regional background: use these percentages as a key for apportionmentamong sectors • for local (traffic) scale: allocate “rest” to resuspended road dust, EC & OC to exhaust and tyre emissions
National Emission Ceilings cleaner vehicles (Dir 98/69) cleaner fuels (Dir 98/70) particle filter for all public buses further substitution of coal by gas, oil and district-heating total: needed: ~ 2% ~ 5% ~ 3% ~ 2 % ~ 2% ~14% ~25% Control measures already on the way Expected total PM10 reduction by 2005
accelerated turnover of car fleet tax incentives for EURO III-V gas-driven vehicles in captured fleets (taxis, driving schools, refuse collection,...) full supply of sulfur free diesel no more coal heating strong reduction (50%) of PM emission by construction reduction (50%) of resuspension in main roads Control measures possible further actions Expected total PM10 reduction by 2005 ~ ?% ~ 3% ~ 2% ~ 3% ~ 7%
Concentrazione media di PM 2.5 in inverno Panoramica sulla salute respiratoria nella Comunità Europea Nov 2000 - Feb 2001 I I I Papa è a letto B E F B CH UK F D E UK E E E S E S S IS
Soglia di allarme75 µg/m3 Soglia di attenzione50 µg/m3 Superamento soglia di allarme PM10 Luglio 2001 – Gennaio 2002 TEOM: 0.98 giorni su 4 Gravimetrico: 0.93 giorni su 2 UNIVERSITA’ DEGLI STUDI DI MILANO-BICOCCAAGENZIA REGIONALE PROTEZIONE AMBIENTALE-LOMBARDIA
Importance for Northern Italy • Short-term effects of air pollution locally confirmed • Very high pollution levels, compared to rest of Europe • High density of major sources of pollution: traffic! • some effects appear to be stronger in Italy: interaction with other high level pollutants such as Ozone ! Cambridge1.ppt
Conclusion • Air pollution has adverse effects on health • Evidence is strongest for short-term effects; long-term effects should be better investigated, in Europe • PM’s are an important aspect of air pollution, but other pollutants and the mixture may be relevant, too • The impact on public health is substantial, in Italy and Europe • Some ‘experimental evidence’ that improvements in air quality lead to health benefits very fastly (short-term effects) Cambridge1.ppt