Download
1 / 25
260 likes | 796 Views
Phase Changes. Sublimation : solid gas. Vaporization : liquid gas. Melting or fusion : solid liquid. Deposition : gas solid. Condensation : gas liquid. Freezing : liquid solid. Phase Changes. ENERGY ASSOCIATED WITH HEATING CURVES. Topics. Vapor Pressure

E N D
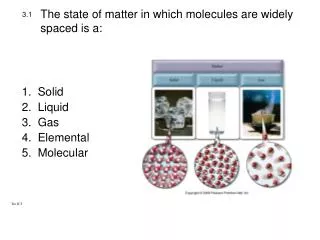
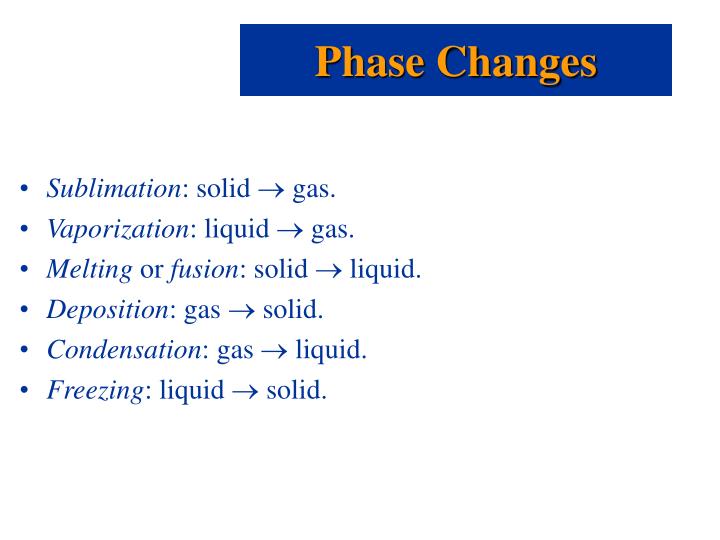
Phase Changes • Sublimation: solid gas. • Vaporization: liquid gas. • Melting or fusion: solid liquid. • Deposition: gas solid. • Condensation: gas liquid. • Freezing: liquid solid.
Topics • Vapor Pressure • Normal Boiling Point • Normal Freezing • Specific Heat • Enthalpy (Heat) of Vaporization • Enthalpy (Heat) of Fusion
Vapor Pressure • THE PRESSURE OF A VAPOR IN EQUILIBRIUM WITH ITS LIQUID (OR ITS SOLID)
NORMAL BOILING POINT & FREEZING POINTS • NORMAL BOILING PT. - THE TEMPERATURE @WHICH VAPOR PRESSURE = 1 atm • NORMAL FREEZING PT. – THE TEMPERATURE @ WHICH THE VAPOR PRESSURE OF THE SOLID AND THE LIQUID ARE THE SAME
Heat Capacity aka Specific Heat (C) • Specific Heat (C) = the amount of energy required to raise the temperature of 1 gram of substance 1 degree celcius
Specific Heat (C) aka Heat Capacity • Units for:specific heat (C) = J/g-oC where J = joules oC = temperature in oC g = mass in grams
Specific Heat (C) Values(aka Heat Capacity) • Example: Water • LIQUID: CLiq = 4.18 J/ (oC . g) • LIQUID: Csol = 2.09 J/ (oC . g) • LIQUID: Cgas = 1.84 J/ (oC . g)
Use of Specific Heat • q = mCDT • q = gm substance x specific heat x DT • where: • M = mass of substance in grams • q = amount of heat (energy) • C = specific heat • And DT = change in temperature
Enthalpy of Vaporizationaka heat of vaporization (DHvap) • Is the amount of heat needed to convert a liquid to a vapor at its normal boiling point
Enthalpy of Fusion aka heat of fusion (DHfus) • Is the amount of heat needed to convert a solid to a liquid at its normal melting (freezing) point
Units for DHvap, DHfus and heat(q) Heat of fusion DHvap = kJ/mol Heat of vaporization DHfus = kJ/mol Heat (q) = Joules
Therefore: • To come up with Joules which is the unit of heat, if: (1) DH is given, then: qvap = DHvap x moles and qfus = DHfus x moles (2) Specific heat (C) is given, then: q = mCDT
Sample Problem • Calculate the enthalpy change upon converting 1 mole of ice at -25 oC to steam at 125 oC under a constant pressure of 1 atm? The specific heats are of ice, water and steam 2.09 J/g-K for ice, 4.18 J/g-K for water and 1.84 J/g-K for steam. For water, DHfus= 6.01 kJ/mol, and DHvap = 40.67kJ/mol. • Note: The total enthalpy change is the sum of the changes of the individual steps.
Take Home Quiz • Do Problem 11.34, page 444 • Due Wednesday at the beginning of class, Dec. 1 • Must show work for full credit • Individual work not required
HEATING CURVES • ENERGY ASSOCIATED WITH HEATING CURVES • During a phase change, adding heat causes no temperature change.
Phase Changes • Critical Temperature and Pressure • Gases liquefied by increasing pressure at some temperature. • Critical temperature: the minimum temperature for liquefaction of a gas using pressure. • Critical pressure: pressure required for liquefaction.
Phase Diagrams • Phase diagram: plot of pressure vs. Temperature summarizing all equilibria between phases. • Given a temperature and pressure, phase diagrams tell us which phase will exist. • Any temperature and pressure combination not on a curve represents a single phase.
Phase Diagrams The Phase Diagrams of H2O and CO2