Download
1 / 1
10 likes | 119 Views
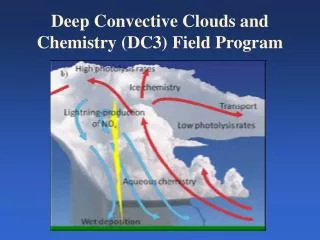
Evidence of Near-Zero Ozone in Deep Convective Clouds from OMI Measurements J. R. Ziemke 1,2 , S. Chandra 1,2 , P. K. Bhartia 2 ,J. Joiner 2 , A. Vasilkov 3 , M. R. Schoeberl 2 , L. Froidevaux 4 , P. F. Levelt 5 , and D. P. Haffner 3

E N D
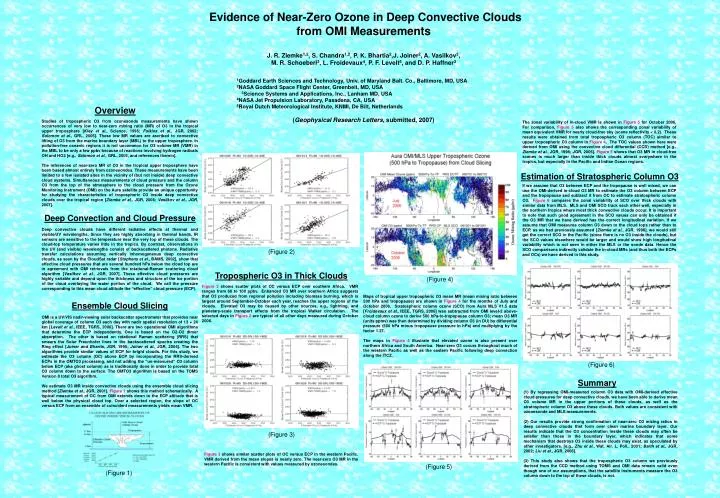
Evidence of Near-Zero Ozone in Deep Convective Clouds from OMI Measurements J. R. Ziemke1,2, S. Chandra1,2, P. K. Bhartia2,J. Joiner2, A. Vasilkov3, M. R. Schoeberl2, L. Froidevaux4, P. F. Levelt5, and D. P. Haffner3 1Goddard Earth Sciences and Technology, Univ. of Maryland Balt. Co., Baltimore, MD, USA 2NASA Goddard Space Flight Center, Greenbelt, MD, USA 3Science Systems and Applications, Inc., Lanham MD, USA 4NASA Jet Propulsion Laboratory, Pasadena, CA, USA 5Royal Dutch Meteorological Institute, KNMI, De Bilt, Netherlands (Geophysical Research Letters, submitted, 2007) Overview Studies of tropospheric O3 from ozonesonde measurements have shown occurrences of very low to near-zero mixing ratio (MR) of O3 in the tropical upper troposphere [Kley et al., Science, 1996; Folkins et al., JGR, 2002; Solomon et al., GRL, 2005]. These low MR values are ascribed to convective lifting of O3 from the marine boundary layer (MBL) to the upper troposphere. In pollution-free oceanic regions it is not uncommon for O3 volume MR (VMR) in the MBL to be only a few ppbv because of reactions involving hydrogen radicals OH and HO2 [e.g., Solomon et al., GRL, 2005, and references therein]. The inferences of near-zero MR of O3 in the tropical upper troposphere have been based almost entirely from ozonesondes. These measurements have been limited to a few isolated sites in the vicinity of (but not inside) deep convective cloud systems. Simultaneous measurements of cloud pressure and the column O3 from the top of the atmosphere to the cloud pressure from the Ozone Monitoring Instrument (OMI) on the Aura satellite provide an unique opportunity for studying the characteristics of tropospheric O3 inside deep convective clouds over the tropical region [Ziemke et al., JGR, 2006; Vasilkov et al., JGR, 2007]. The zonal variability of in-cloud VMR is shown in Figure 5 for October 2006. For comparison, Figure 5 also shows the corresponding zonal variability of mean equivalent VMR for nearly cloud-free sky (scene reflectivity < 0.2). These results were obtained from total tropospheric O3 column (TOC) similar to upper tropospheric O3 column in Figure 4. The TOC values shown here were derived from OMI using the convective cloud differential (CCD) method [e.g., Ziemke et al., JGR, 1998; JGR, 2005]. Figure 5 shows that O3 MR in cloud-free scenes is much larger than inside thick clouds almost everywhere in the tropics, but especially in the Pacific and Indian Ocean regions. Estimation of Stratospheric Column O3 If we assume that O3 between ECP and the tropopause is well mixed, we can use the OMI-derived in-cloud O3 MR to estimate the O3 column between ECP and the tropopause and subtract it from OC to estimate stratospheric column O3. Figure 6 compares the zonal variability of SCO over thick clouds with similar data from MLS. MLS and OMI SCO track each other well, especially in the northern tropics where most thick convective clouds occur. It is important to note that such good agreement in the SCO values can only be obtained if the O3 MR that we have derived has the correct longitudinal variation. If we assume that OMI measures column O3 down to the cloud tops rather than to ECP, as we had previously assumed [Ziemke et al., JGR, 1998], we would still get the correct SCO in the Pacific (since there is no O3 inside the clouds), but the SCO values elsewhere would be larger and would show high longitudinal variability which is not seen in either the MLS or the sonde data. Hence the SCO comparisons indirectly validate the in-cloud MRs (and thus both the ECPs and OCs) we have derived in this study. Deep Convection and Cloud Pressure Deep convective clouds have different radiative effects at thermal and visible/UV wavelengths. Since they are highly absorbing in thermal bands, IR sensors are sensitive to the temperature near the very top of these clouds. The cloud-top temperature varies little in the tropics. By contrast, observations in the UV (and visible) wavelengths consist of backscattered photons. Radiative transfer calculations assuming vertically inhomogeneous deep convective clouds, as seen by the CloudSat radar [Stephens et al., BAMS, 2002], show that effective cloud pressures that are several hundred hPa below the cloud top are in agreement with OMI retrievals from the rotational-Raman scattering cloud algorithm [Vasilkov et al., JGR, 2007]. These effective cloud pressures are highly variable and depend upon the thickness and structure of the ice portion of the cloud overlaying the water portion of the cloud. We call the pressure corresponding to this mean cloud altitude the “effective” cloud pressure (ECP). (Figure 2) Tropospheric O3 in Thick Clouds (Figure 4) Figure 2 shows scatter plots of OC versus ECP over southern Africa. VMR ranges from 60 to 100 ppbv. Enhanced O3 MR over southern Africa suggests that O3 produced from regional pollution including biomass burning, which is largest around September-October each year, reaches the upper regions of the clouds. Elevated O3 may be caused by other sources, e.g., lightning, and planetary-scale transport effects from the tropical Walker circulation. The selected days in Figure 2 are typical of all other days measured during October 2006. Maps of tropical upper tropospheric O3 mean MR (mean mixing ratio between 500 hPa and tropopause) are shown in Figure 4 for the months of July and October 2006. Stratospheric column ozone (SCO) from Aura MLS V1.5 data [Froidevaux et al., IEEE, TGRS, 2006] was subtracted from OMI level-2 above-cloud column ozone to derive 500 hPa-to-tropopause column O3; mean O3 MR (units ppmv) was then determined by dividing column O3 (in DU) by differential pressure (500 hPa minus tropopause pressure in hPa) and multiplying by the factor 1.27. The maps in Figure 4 illustrate that elevated ozone is also present over northern Africa and South America. Near-zero O3 occurs throughout much of the western Pacific as well as the eastern Pacific following deep convection along the ITCZ. Ensemble Cloud Slicing OMI is a UV/VIS nadir-viewing solar backscatter spectrometer that provides near global coverage of column O3 each day with nadir spatial resolution of 13 × 24 km [Levelt et al., IEEE, TGRS, 2006]. There are two operational OMI algorithms that determine the ECP independently. One is based on the O2-O2 dimer absorption. The other is based on rotational Raman scattering (RRS) that smears the Solar Fraunhofer lines in the backscattered spectra creating the Ring effect [Joiner and Bhartia, JGR, 1995; Joiner et al., JGR, 2004]. The two algorithms provide similar values of ECP for bright clouds. For this study, we estimate the O3 column (OC) above ECP by incorporating the RRS-derived ECPs in the OMTO3 processing, and not adding the “un-measured” O3 column below ECP (aka ghost column) as is traditionally done in order to provide total O3 column down to the surface. The OMTO3 algorithm is based on the TOMS Version 8 total O3 algorithm. We estimate O3 MR inside convective clouds using the ensemble cloud slicing method [Ziemke et al., JGR, 2001]. Figure 1 shows this method schematically. A typical measurement of OC from OMI extends down to the ECP altitude that is well below the physical cloud top. Over a selected region, the slope of OC versus ECP from an ensemble of coincident measurements yields mean VMR. (Figure 6) Summary (1) By regressing OMI-measured column O3 data with OMI-derived effective cloud pressures for deep convective clouds, we have been able to derive mean O3 volume MR in the upper portions of these clouds, as well as the stratospheric column O3 above these clouds. Both values are consistent with ozonesonde and MLS measurements. (2) Our results provide strong confirmation of near-zero O3 mixing ratios in deep convective clouds that form over clean marine boundary layer. Our results indicate that the O3 concentration inside these clouds may often be smaller than those in the boundary layer, which indicates that some mechanism that destroys O3 inside these clouds may exist, as speculated by other investigators. [e.g., Zhu et al., Wat. Air. L. Poll., 2001; Barth et al., JGR, 2002; Liu et al., JGR, 2006]. (3) This study also shows that the tropospheric O3 column we previously derived from the CCD method using TOMS and OMI data remain valid even though one of our assumptions, that the satellite instruments measure the O3 column down to the top of these clouds, is not. (Figure 3) Figure 3 shows similar scatter plots of OC versus ECP in the western Pacific. VMR derived from the mean slopes is nearly zero. The near-zero O3 MR in the western Pacific is consistent with values measured by ozonesondes. (Figure 5) (Figure 1)