Download
1 / 24
350 likes | 756 Views
Lecture 6 Multispectral Remote Sensing Systems. Overview . • Satellite orbits are designed according to the capability and objective of the sensors they carry. • The velocity of satellite can be calculated by the formula:

E N D
Lecture 6 Multispectral Remote Sensing Systems
• Satellite orbits are designed according to the capability and objective of the sensors they carry. • The velocity of satellite can be calculated by the formula: where G is the universal gravitational constant and M is the mass of the Earth. • The orbit period (p) can be determined by the formula: • The height of a satellite above the earth’s surface can be expressed as: h = Ro − Re = Ro − 6371 • Below 180 km, the Earth’s atmosphere is too dense for satellites to orbit without burning as a result of frictional heating. Above 600-800 km, there is little atmosphere drag that a satellite will remain in high orbit indefinitely. Satellite orbits
Satellite orbits: Geostationary • The geostationary satellites go around the Earth at speeds which match the rotation of the Earth so they seem stationary relative to the Earth's surface. Geostationary satellites complete a orbit in 24 hours. • The orbit is circular. And its inclination is zero degrees, which means that it is above the Earth's equator. • Weather and communications satellites commonly have these types of orbits. Due to their high altitude some geostationary weather satellites can monitor weather and cloud patterns covering an almost entire hemisphere. • It can frequently and repetitively observe and monitor the same portion of the Earth for the purpose of detecting, tracking and predicting the weather or natural hazards. • Ideal for making repeated observations of a fixed geographical area centred on the equator, polar areas are always covered poorly. Geostationary satellite images of the polar regions are distorted because of the low angle the satellite sees the region. • Meteosat(ESA, covering Europe and Africa) • GOES-EAST(NOAA, covering North and South America) • GOES-WEST(NOAA, covering Eastern Pacific) • GMS(Japan, covering Japan and Australia, Western Pacific) • Fengyun-2(China, covering China and the Indian Ocean) • GOMS (Elektro) ((Russia, covering Central Asia and the Indian Ocean) • INSAT (India)
Satellite orbits: Polar orbits sun-synchronous • Most of the remote sensing satellite platforms are in near-polar orbits. They pass over or near the north and south poles each revolution. • Polar orbiting satellites can provide global coverage of the atmosphere and Earth surface. • Polar satellites circle at a much lower altitude (~800km) providing higher quality remote sensing data (more detailed information) than geostationary satellites. • Short orbital periods - 98 to 102 minutes. • As the earth rotates to the east beneath the satellite, each pass monitors an area to the west of the previous pass. These 'strips' can be pieced together to produce a picture of a larger area (mosaic). • Typically, near polar orbit satellites are also designed in sun-synchronous orbits. In a sun synchronous orbit a satellite passes over each area of the Earth’s surface at a constant local time of day called local solar time.
Sun-synchronous polar orbits – Ascending and descending passes • Ascending passes of the orbit corresponds to that portion of the orbit when the satellite is moving from south to north, while descending passes of the orbit corresponds to north to south movement. • Most sun-synchronous polar orbiters have the ascending pass is on the shadowed side of the Earth, while the descending pass is on the sunlit side. • Sensors recording reflected solar energy only image the surface on a descending pass, when solar illumination is available. • Active sensors that provide their own illumination or passive sensors that record emitted radiation can also image the surface on ascending passes. Descending pass Ascending pass
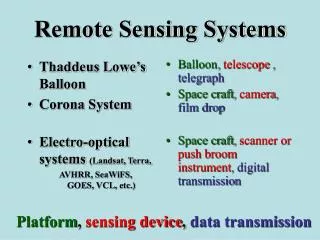
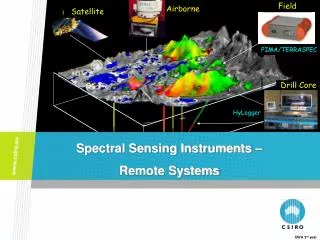
Remote Sensing Systems • Two major categories of remote sensing systems - • Framing system and • Scanning system. • • Framing systems instantaneously acquire an image of a large area (or frame) on the terrain. Cameras are common examples of such systems. • • A scanning system employs detectors with a narrow field of view that is swept across the terrain in a series of parallel scan lines to produce an image. • • Generally electro-optic sensors are used in scanning systems.
Electro-optical Sensors • In contrast to photographic cameras that record radiation reflected from a ground scene directly onto film, electro-optical sensors use non-film detectors. • Electro-optical detectors record the reflected and/or emitted radiation from a ground scene as electrical signals, which are converted into the image DN values.
Electro-optical Sensors • Electro-optic sensors comprise 1-D or 2-D detector arrays of photosensitive solid-state devices (photodiodes). • Each photosite (position in the array) sense one pixel in the image field; typically there is one photodiode per photosite. • The incoming radiance is converted to electrical signal at these photosites. • Most widely used electronic detector arrays are CCD (Charge-coupled device) sensors • CCDs have good light sensitivity, produce data with less noise, and require less time for processing the image
Electro-optical Sensors CCDs image sensors are monochromatic. In the case of typical digital cameras, to obtain full color data, each photosite of the CCD is covered with a blue, green or red filter. Usually the photosites are square with alternating red-, green- and blue- sensitive sites (Bayer pattern). Each photsite senses one color, the values of the other two colors are determined by interpolation from the neighboring photosites. So one essentially has an array of pixels, each containing 3 brightness (or DN values), one for each color. Color depth of a CCD sensor is the number of brightness levels it can detect per band – typically 8 bits (256 levels) to 12 bits (4096 levels)
Flight line/path, scan lines, ground resolution cell, and pixels Flight line – the path of the sensor platform (satellite/air craft) Scan line – The line along which the sensor scans the ground Ground resolution cell – The ground segment sensed at any instant Pixel – (picture element ) the radiometric response of the ground resolution cell on the image
IFOV and ground resolution cell IFOV (Instantaneous field of view) is the cone angle within which the incident energy is focused on the detector Determined by the instrument’s optical system and size of the detectors. All energy propagating towards the sensor within the IFOV contributes to the detector’s response at any instant The ground resolution cell within a IFOV can have homogenous (pure pixels) or heterogeneous composition (mixed pixels).
IFOV and ground resolution cell D = H′β, where β is in radians D is loosely referred to as the spatial resolution of the system. Since H′ within a IFOV increases away from the nadir, the ground resolution cell increases away from nadir. Smaller IFOV >> better spatial resolution, poorer signal-to-noise ratios Higher IFOV >> better radiometric resolution, better signal-to-noise ratios, longer dwell time Higher signal-to-noise ratios for small IFOV can also be achieved by taking data over larger wave bands – thus lowering spectral resolution (ability to discriminate fine spectral difference) Nadir
Digital imaging Digital images are created by quantizing an analog electrical signal - (A-to-D conversion. The response of the detector to the incoming radiance from the IFOV is in the form of a continuous analog signal. The continuous signal is sampled at and specified time interval and recorded numerically at each sample point. The sampling rate is determined by the highest frequency of change in the signal – it should be twice as high as the highest frequency present in the signal. DNs The ground distance between adjacent sampling points need not be exactly equal to IFOV projected on to the ground
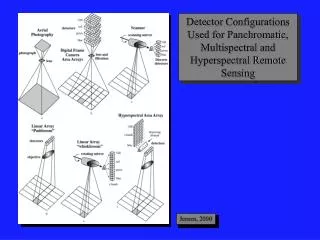
Detector Configurations Used for Panchromatic, Multispectral and Hyperspectral Remote Sensing
Across-the-track and along-the-track scanning Linear detector array Rotating mirror Optics Platform motion Scan line Across-the-track/whisk broom Along-the-track/push broom
Using a rotating mirror, this system scan the terrain along lines that are perpendicular to the direction of motion of the sensor platform. Scanner repeatedly measure the energy from one side of the satellite platform to the other. • As the platform moves forward over the Earth, successive scans build up a 2-D image of the Earth’s surface. • An array of electro-optic detectors are located on focal plane. • The angular field of view (Total Field of View) is the sweep of the mirror used to record a scan line, and determines the width of the imaged swath. • Across-track scanner can be mounted on both aircrafts and satellites. Airborne scanners typically sweep large angles (between 90° and 120°), while satellites, because of their higher altitude need only to sweep small angles (10-20°) to cover a broad region. • Because the distance from the sensor to the target increases towards the edges of the swath, the ground resolution cells also become systematically larger and introduce geometric distortions to the images. Across-the-track (whiskbroom) scanning Rotating mirror
Characteristics of across-the-track scanner imagery Dwell Time Compare the dwell times of HRVIR, ETM and ASTER sensors in the VNIR band. Polar radius of the earth: 6356 km
Geometric characteristics of across-the-track scanner imagery Tangential-scale Distortion Constant angular velocity of the rotating mirror Resulting variations in linear velocity over a ground resolution cell
Geometric characteristics of across-the-track scanner imagery Tangential-scale distortion correction Where, yp is the distance of the image point from the nadir ymax is the distance of the image edge from the nadir θmax is the one half of the total field view of the scanner
Geometric characteristics of across-the-track scanner imagery Resolution cell size variation Since D = H′β, The values of D would increase as the distance from the nadir increases β θ β H′ Hθ′ = H′sec θ H′β (H′sec θ)β (H′sec2θ)β
Geometric characteristics of across-the-track scanner imagery One-dimensional relief displacement Vertical frame photograph Flight direction
Geometric characteristics of across-the-track scanner imagery Resolution cell size variation