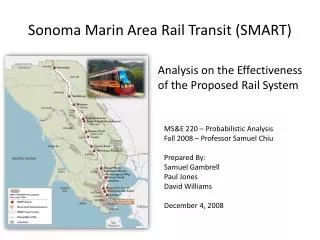
Sonoma Marin Area Rail Transit (SMART)
190 likes | 288 Views
This study analyzes the effectiveness of the Sonoma-Marin Area Rail Transit (SMART) system using probabilistic decision tools. It includes examining ridership projections, costs, revenue, and decision trees to assess the viability of supporting the rail system. The analysis incorporates input probabilities, ridership assessments based on station proximity, financial model predictions, and the likelihood of cost overruns. The findings aim to provide insights into the decision-making process regarding the proposed railway system.

Sonoma Marin Area Rail Transit (SMART)
E N D
Presentation Transcript
Sonoma Marin Area Rail Transit (SMART) Analysis on the Effectiveness of the Proposed Rail System MS&E 220 – Probabilistic Analysis Fall 2008 – Professor Samuel Chiu Prepared By: Samuel Gambrell Paul Jones David Williams December 4, 2008
Overview • This analysis will examine the probabilities related to making a decision on whether to support the Sonoma Main Area Rail Transit system • This includes: • Creating a decision analysis tool • Examining input probabilities to the model • Ridership • Costs & Revenue
Decision Analysis • This process used decision trees, to structure the probability inputs • Values of different outputs are assigned by the user • Feedback on whether they should or should not support the decision is provided • So is a measure of how much change is required for them to change their position
Value from User Results and change of preference required to alter position
Population within 1 mile of station Calculation for Santa Rosa (special case overlapping station radii) Commuters within 1 mile of station are significantly more likely to use SMART Distance between Santa Rosa Stations = 1.18 milesTotal area of Santa Rosa within 1 mile of train station is = 5.36 square miles (see spreadsheet for calcs) Population Density for Santa Rosa = 3844 people per square mile Santa Rosa Residents within 1 mile of SMART station is = 3,844 x 5.3564 = 20590
Low Projection:Assessed Ridership Conditioned on Proximity to Station and Commuter Status
High Projection:Assessed Ridership Conditioned on Proximity to Station and Commuter Status
Projected Riders vs. Gas Price E. D. C. B. A.
Sales Tax Growth • Obtained Taxable Income from Sales for 1998 thru 2007 through California BOE • Due to the complexity and uncertainties of a financial model a normal curve was used with the mean and SD of historical data to predict growth • Dynamic equations were used to predict Taxable Income till 2029
Model vs Paper • According to the model the paper has a 99.85% chance of making the predicted income from sales tax
Assumed Income Currently unable to find a source for an accurate probability.
Probability of a Cost Overrun • Based on Transit systems built since 1994 • Used to calculate the probability of a cost overrun • Assumed normal