Download
1 / 42
420 likes | 523 Views
Singapore Integrate & coordinate the SCITe Teams. SCITe - Supply Chain Improvement through Technology in an e-world… Proposed additions to the work- stream decks May 21-25, 2001. Singapore cross-team coordination. Pwc role to review work-stream Approach/ToR/Scope/Deliverables in view of:.

E N D
SingaporeIntegrate & coordinate the SCITe Teams SCITe - Supply Chain Improvement through Technology in an e-world… Proposed additions to the work- stream decks May 21-25, 2001
Singapore cross-team coordination Pwc role to review work-stream Approach/ToR/Scope/Deliverables in view of: • 1. Findings fromPARIS, INTEGRATE and Data work in London: • The business problem that’s different • Focus on teams not the solution • The project time line & route map • 2. INTEGRATE - Customers and their SCITe “handshake” requirements • 3. PARIS - The working model re: i2 (APS) supply chain vision Input from these teams for London sessions - next week
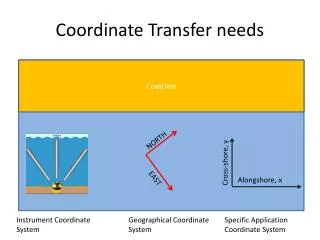
Is supply chain thinking applicable to MSD ? MSD mission... Trade Crude Refine Trade Product Market Wholesale Sell Retail The downstream supply chain is: • Global by its nature for both crude and products • Collaborative with multiple partners at every step • Virtual with assets leveraged across multiple companies • An increasingly complex supply web But the supply chain challenge is…... Translating lessons learned from other industries to achieve similar benefits
Supply chain revolution - Fact or fiction ? CPG 1 - HJ Heinz 2 - Hershey’s 3 - Nabisco 4 - Kellogg 5 - Campbell Cisco Wal*Mart Anheuser Busch Retail 6 - Sears 7 - Coles Myer 8 - Safeway Value Unilever 3 8 4 2 1 7 Hi-Tech 9 -Lucent 5 9 6 E-Procurement & Transaction Automation Value Chain Integration Collaborative Commerce & Business Innovation Virtual Physical Consumer Goods and Retail companies are generally focused here ... … the ultimate battleground could be here … eMarkets initiatives focus here …
PARIS: applying supply chain thinking to MSD? Bulk crude & products is the MSD business …. Units: Kbd Equity Production (60) Discretionary Demand (40) 100 100 100 100 Refinery Scheduling Terminals Customers Crude Supply Term Purchase (20) Base Demand (60) Spot Purchase (20) Classic: LP asset optimisation focus on “non-discretionary demand
100 100 110 100 The PARIS team thinking Units: Kbd Exchange Deliveries (20) Term Sales (10) Spot Sales (20) Spot Sales (30) The classic view does not tell the whole story… Intermediates (20) Discretionary Demand (40) Equity Production (60) Refinery Scheduling Terminals Customers Crude Supply Term Purchase (20) Base Demand (60) Spot Purchase (50) Feedstocks (20) Spot Purchase (30) Term Purchase (10) Exchange Receipts (20) …100 Kbd system needs 240 Kbd of trades to meet demand Challenge: Using “discretionary” demand to define the new supply chain
PARIS Team - Approach & Scenarios MARTY/BILL Work
Integrate customer view Data and Information Management Demand Management Primary Distribution Supply Chain and Refinery Planning (Paris) Refinery Scheduling (Sydney) Proposed workshops: timeline Singapore Sessions April/May May/June June/July Workstreams 502 Key Items 1 2 3 CSF’s NPV Options Costs Risks Benefits 1 2 1 2 Combined Session 1 2 3 2 3 4 1 1 3 2 Key “To-be” Business Requirements i2 gap quantified & Benefits assessment Functional workshops 502 inputs finished Alignment workshops 502 preparation Assumption: Workshops will be two full days
High Level Time Line Route Map End May Mid to end Jun • Define business scenarios around the software : • Periodic replan • Opportunity inside the planning cycle • Optionality across zones/envelopes • Reaction to upset • Define business scenarios by zone/envelope : • Demand driven • Mode - pipeline, marine, exchanges • Volume/capacity • Supply flexibility - exchanges etc Define business entities, attributes and requirements by workstream across the process areas Compile integrated business requirements Handover for development requirements (i2) Business requirements stream 1 Run further workshops to complete Construct proposed solution process Define Project Vision, Scope, Boundaries and Interfaces Incorporate customer view Complete ‘As Is’ IPO information Business process & organisation stream 2 Categorise opportunities into areas impacted, possible quick wins by area and potential benefits Collect issues and opportunities information Benefits stream Define business dimension information by physical and capacity Define benefit categories inc optimisation, timing,stability of data etc 3 Categorise business dimension information Define 502 requirements and level of detail Collect further business dimension information req’d Data Management stream Compile list of candidate physical databases Assess interfaces with other BU data models Complete collection of current data capabilities 4 Validate LDM starting point Update LDM with current thinking Assess fit of existing physical databases
High Level Time Line Route Map End July Mid August Estimated (i2) time to define development requirements, costs and rollout plan 1 Construct 502 Develop final implementation rollout plan & time phased benefits Gap analysis Vision, scope and boundaries Development cost to build by BR release (module) Time phased benefits case Benefit by BR release Proposed license cost Development & implementation plan & costs Proposed hardware, middleware and Honeywell cost Define key ‘To Be’ business processes & KPIs (rough cut) 2 Organisation impact analysis - processes, people, skills, training Define key organisation impacts ( inc skills,structure, resources) Define risks & mitigation strategy Risks analysis and mitigation strategy 3 Develop benefits case Define benefits from better data management Define support organisation Define migration path Design high level physical model 4 Define architecture Define organisation ownership
We are solving a business problem • Concentrate on how to organize to solve this problem - not the solution, yet • Where does each team start/stop • What is the best level-of-detail • Do a high level definition of interfaces first • Define key outputs for each team • Then how they tie together • Need marketing, commercial & trading input • Do not throw everything into the database • Mixed vocabulary is killing us... Ideas to work the interface problem
“Handshake” definition Current & Future Crude & Product Prices, Product Demands Integrate Team Internal Processes Internal Processes Traders - Replan - Replan Plans Programmes Plans Programmes Plans Programmes - Mode, from/to - Product move, to/from - When - Dispatch from/to - Product Move from - When Internal Processes - Product Lifting, From - When - Production guidelines S c h e d u l e s A c t u a l s Constraints/Options/Deviations Cons/Options/Deviations Customers Internal Processes • Retail • Commercial • Chemicals • Lubes • Specialties Internal Processes Internal Processes Sec Distr ??? Potential team interface diagram Demand Forecasting & Management Team PARIS Team - Base Problem CSA DSS Aspect Month S c h e d u l e s S c h e d u l e s A c t u a l s Week S c h e d u l e s t o P l a n t s A c t u a l s C r u d e ATP Day Sydney Team PDS Team ??? Secondary Distribution Acquire Crude Manufacture Primary Distribution
INTEGRATE Team - customer facing input Europe interviews to date (5/22/01)…. Samia Nehme - LPG eBusiness manager Patrick Romeo and Morgan Hurwitz - Business Development manager and eBusiness Manager Andrew Macmillan - Marine Products, Lubricants Supply Jos Steeman - Commercial/Retail - Head of eBusiness SEOP formerly Retail Network Mgr Europe Andrew Gammie - OP Retail Strategy
INTEGRATE Team - tactics & findings • Other Work-stream Review: • Demand Team • Paris Team Develop “Scenarios” Develop “Handshakes” Engage secondary distribution Customer rep interviews (fuels): - Commercial - Retail - Aviation - LPG Identify key customer contacts Deliverable Format Final Deliverables Initial ToR Revised ToR
Template: Handshakes” with customers Customer Group:___________________ SCITe “Handshake” Customer view of Importance Shell Supply Presence (A) Product Characteristics (B) Secondary Distribution Importance(C) Control of Inventory Who & Importance(D) Other Key Factors Affecting Supply Chain (E) Direct Salesto Customer Very High Shell Dominates Indirect Salesto Customer Direct Salesto Customer Very Low Competitors Dominate Indirect Salesto Customer E-Initiatives underway (categorize across matrix): 1. Order entry/order management 2. Align information with physical flow 3. Collaborative planning: Supply Inventory Price 4. Possibility of an exchange as a new “virtual” customer
INTEGRATE - Commercial customers “Handshakes” Customer Group: Commercial SCITe “Handshake” Definition Customer view of Importance
Handshake comments from interviews • Everyone wants availability @ price. Many comments around: • Integrated margin information, by product • “Real time” customer pick-up information • Granular delivery status • Early warning of product availability issues • Lots of comments around demand forecasts • Marketing data is disregarded • Usually based on historical data from distribution
Customer facing “To Be” Business Scenarios Completed: 1.0 Gold/Silver/Bronze Customer Service Segmentation 2.0 Wholesale business model 3.0 Online bidding 4.0 Customer Access to Shell on-line - ATP 5.0 Transparency of Market Trends 6.0 Supply chain upsets opportunities/ constraints e.g. Changes in discretionary demand pattern in price war situation Under Development: 7.0 White Pump sites 8.0 Ability to hedge position at all points of the supply chain 9.0 Secondary distribution issue
Customer facing “To Be” business scenarios • 1.0 Gold/Silver/Bronze Customer Service Segmentation • The Group Commercial Strategy(GCS) is driving the Commercial Business to reduce its current costs to serve its customers. One of the choice methods for doing this will be to segment customers into three service groupings. The segmentation is base on cost to serve together with the customer’s recognition and predispostion to buy additional value over the base offering. The base offerings in each grouping will change from country to country and a customer may be in a different group for lubes and fuels. Offerings within one grouping may not be offered to a customer in a lower group, or if they are the customer will pay a surcharge fee for the use of that offering. • Impact On SCITe • The key areas of impact on the supply chain beyond the ones mentioned in Business Scenario 3.0 are as follows: • Each grouping will have different commitments in regard to supply. Gold customers may have guaranteed supply. The planning and scheduling of supply must support these service groupings. • Transparency of supply chain costs is critical to ensure that costs used by a service group or even an individual offer are recovered in the fees. (No more cross subsidisation and averaging of costs into tarrifs and surcharges). • The cost to serve at the customer/product/site level have to be clearly understood to put the customer into the correct grouping. Ie. a customer is within an expensive Fuels supply envelope they cannot be but into Bronze for Fuels without additional transport surcharges being levied to that customer.
Notes: • indicates demand by product by channel • Pipeline envelope example • With exchanges (A - B) • Rack demand at Terminals (T1 …… TN) Area 1 T1 T4 T3 T2 T2 T5 Other bulk demand Chemicals Base Oils Intermediates A exchange supply in exchange payback out B T6 T7 T8 Remainder is Area 2 Current supply plan linear programme Plant Plans Net demand on plant by refined product Sydney Team Actuals Schedules Honeywell? APS intro: Demand driven supply chain
APS Intro: Demand driven view No Contract Contract A Firm Categorise each zone D B C E Discretionary
SCITe Scope - The Shell Triangle GTN 3rd party customer/supplier e.g. Trading houses, other oil companies, Marine shipping companies • Within planning cycle update • Who sells it? • What price? 3rd party customer MSD e.g. Retail, Commercial, Aviation, Marine, Chemicals (LO & Aroms), Base oils, LPG, Bitumen Shell Sales Organisations Sec Distr 3rd party delivered customer 3rd party customer/supplier e.g. Domestic, Export, Supply Sales, Exchanges Setting the three major planning cycle modes
Within planning cycle update • How is it sold? • What price? Cycle modes and the likely affected customers The Planning Cycle Response Modes GTN Planning cycle mode II: Incremental opportunity MSD Shell sales organisations Planning cycle mode I: Periodic re-plan (Weekly) • Planning cycle mode III: Manage Upsets • Quick respond • Quickly stabilise
Review PD Database - Size, Complexity & Control * * * * * * *
MSD supply chain vision capabilities MSD supply chain vision must deliver: • The whats: • The time & tools to continually evaluate new opportunities • Faster response times - across a network • Ability to leverage volatility and manage risk • More visibility between plants and trading • Economic foundation for more ‘Buy’ vs ‘Make’ decisions • The hows: • Synchronised planning & plant scheduling • Routinely optimising the global supply chain • What-if simulation of new business scenarios in real time • 24X7 supply planning capability
APS intro: Where does i2 fit - currently? Source: Gartner Group
Suppliers Retail Manufacturing Distribution Don’t forget - SPOT All levers of change required for success... Network Strategy Develop Supply Chain Strategy Integrated Supply Chain Planning Business Processes Manage Customer Orders Procure Materials & Services Produce Products / Services Manage Logistics / Distribution Forecasting Enterprise-wide Backbone Customers Retail Management Systems Organization Terminal Systems Refinery Control Systems Technology Cannot forget “Facilities” in the downstream business...
Benefits approach: SCITe Charter Building on Shell’s current position; need to address the following issues: • Are our supply chain processes and tools ‘e-ready’ and able to support a range of new B2B and e-marketplace developments? • How adaptable are our supply chain processes and tools to growing trend towards ‘collaborative’ supply chains, where we may no longer control (or own) all the links in the chain? • What shape is our data in? To what extent is it consistent, structured and shareable across the business, to support high quality decision-making? • How well would our supply chain processes and tools respond to further ‘globalisation’ of our own business and the businesses of the internal/external customers we serve?
Team Leads: Benefit Discussion - 23/05/01 A PwC & team level set on work to date... “West” • Original MAS Study: $.25 -.30/bbl….Considered unrealistic “East” • Conducted 2 day cross-functional operations & planning workshop in October • Identified categories of benefit (attached) • Considered benefits against an “optimized base case” • Used as “backdrop as it applies to Europe • Validated with Europe representatives (?) • Came up with defendable $.06-.08/bbl (East)
PDS Team Benefits Approach - Drivers • Why use them? • Description of PDS team’s approach • Question: Are the benefit drivers for the other teams the same? If not, what are they?
More accurate, timely and visible information enables better performance measurement, resulting in better tactics and strategy PDS Benefits Approach - seven drivers Increase Shareholder value Maintain/Build Revenue Lower expenses Better use of capital 3. Fewer unplanned events; better recovery 1. Lower cost of logistics solutions 6. Working capital reduction 2. Lower system product cost 7. Improved asset management & utilisation 3. Feer unplanned events; better recovery 4. More productive workforce 5. Lower cost of industry collaboration
Team Leads: Benefit Discussion - 23/05/01 Recommended approach to develop 502 benefits case… Assumptions: • Use East $.06-.08/bbl as base case • Focus new benefits case on how to achieve them • Use PwC Shareholder Value template & Customer & People “Value drivers” Approach: • Work with the teams to identify added categories of value • Present “East” results (by summary category) to show what’s been done • Identified additional categories of benefit - by team (see attached) • Quantify “sheer volume” of benefit potential across supply chain • Consider SCITe benefits against an “optimized base case” • Consider use of questionnaire to get engagement - similar to PDS team
Team Leads: Benefit Discussion - 23/05/01 Define ways to capture the benefits… Approach: • Use East $.06-.08/bbl as base case • Add (or subtract) “Big ticket” items identified by other teams • Decide how they will be measured • Identify appropriate enabler (proposed list below): • i2-APS Application Capability • Data Quality & Access Improvement • Process Improvement • People/skills/organization • Stage the benefits with “staircase” rollout strategy to complete 502 • Identify risks (or blockers), e.g.: • Adaptability of staff to new way of doing the business • Competition for staff resources with other MSD initiatives • Applicability of other Shell (external) initiatives • e-markets (Levelseas, ICE & IPE, etc.) • G-initiatives (GRS, GDS, GLI, etc)
East Team & PDS - Benefit Categories Backup on $.06-.08/bbl... • Workshops done: • MAS & East Zone Studies • Cheaper Crudes • Optimal Crude Mix • In-Month Supply Balance Optimization • Optimized/integrated Scheduling • Leverage Envelope / Zone Network • Supply Chain Churn/Distress • Exploiting Market/Trading Value • Higher Supply/Trade Margins • Primary Transportation Cost Reduction • Secondary Distribution & Customer Management • Strategic Value Opportunities
Sample MAS Format - In month supply balance Size of Opportunity Solution Impact Opportunity = $.015/bbl • Throughout the course of a month, demand and price volatility create supply and demand imbalances resulting in many decision opportunities. e.g. - make, buy, exchange, sell, within zone, diff channels, let inventory build vs...... forward prices (have to re-optimize as holding and sacrificing other barrel opportunities), replenishment from refinery when should be buying from market to replenishment, high margin opportunities based on price and demand changes. • Opportunity estimated at additional $100K per month for Stanlow = $1.2 million/yr for .219MBD = $.015/bbl. Current initiatives = minimal; Solution Factor 75% $.015 * 76% = $.0113/bbl • Enablers • General/BR0: • Common data model for supply chain. Incorporates total demand, time-phased economics, constraints and events (e.g.. transportation constraints, planned turnarounds) etc. • Common eBusiness framework, to link all parties involved in an in-month decision (Supply Chain Integrators, Traders etc.) via a collaborative desktop environment. • Paris BR2: • Short time-horizon (e.g.. 10 days) daily or on-demand replanning/reoptimisation, based on individual events/opportunities, in-month demand volatility etc. • Supply chain view of multiple options, incorporating economics of each option Root Causes Fractured tools & silo organizations Labor intensive evaluation of options requiring use of multiple tools, and hand calculations. Inability to quickly review impact on terminal and refinery stock feasibility No economic integration of “refinery exchange” options within operational decision making. Separate optimizations performed on different elements within the supply chain, (e.g. refinery & distribution) which suggest different decisions. Currently, no actual production costs available to integrator Currently, no inter-month process to review demand and price to stop or slow production and buy in market Need to include transportation costs and forward pricing