Download
1 / 55
2.03k likes | 3.33k Views
PDCA. A Tool For Continuous Improvement. Objectives. Introduce Lean Six Sigma (LSS) principles Identify the steps of the PDCA problem solving model used in a LSS model Identify and use various quality problem solving tools Identify an use various team dynamic tools

E N D
PDCA A Tool For Continuous Improvement
Objectives • Introduce Lean Six Sigma (LSS) principles • Identify the steps of the PDCA problem solving model used in a LSS model • Identify and use various quality problem solving tools • Identify an use various team dynamic tools • Standardize corporate wide PDCA process
LSS Yellow Belt • A Lean Six Sigma Yellow Belt is an individual who has a broad understanding of LSS and the basic continuous improvement tools • Yellow Belts participate on improvement teams as well as use the tools, as applicable, in their day-to-day jobs
What is Six Sigma • Six Sigma is a business management strategy, originally developed by Motorola, that today enjoys widespread application in many sectors of industry • Six Sigma seeks to identify and remove the causes of defects and errors in manufacturing and business processes. Its primary focus is on process targeting and variation reduction • It uses a set of quality tools, including statistical methods, and creates a special infrastructure of people within the organization who are experts in these methods • Each Six Sigma project carried out within an organization follows a defined sequence of steps and has quantified financial targets (cost reduction or profit increase)
“Lean” is a business management strategy, originally called the “Toyota Production System” that was born at Toyota in the early 1950’s What is Lean
7 Forms of Waste CORRECTION MOTION Repair or Rework WAITING Any wasted motion to pick up parts or stack parts. Also wasted walking Any non-work time waiting for tools, supplies, parts, etc.. Types of Waste OVER PROCESSING OVERPRODUCTION Producing more than is needed before it is needed Doing more work than is necessary INVENTORY TRANSPORTATION Maintaining excess inventory of raw mat’ls, parts in process, or finished goods. Wasted effort to transport materials, parts, or finished goods into or out of storage, or between processes.
What is Lean Six Sigma (LSS) Lean Six Sigma is a business management strategy that combines the tools and techniques of Lean Manufacturing and Six Sigma to form an integrated continuous improvement strategy
Costs Total Product or Service Price to Customer Profit Profit Budget Constraints and Competition Drive aLowered Price Profit Waste (COPQ) TotalCost to Produce or Provide Profit Profit TheoreticalCosts i.e., Cost ofDoing theRight ThingsRightthe FirstTime Waste (COPQ) COPQ TheoreticalCosts TheoreticalCosts 0 A. E. B. C. D.
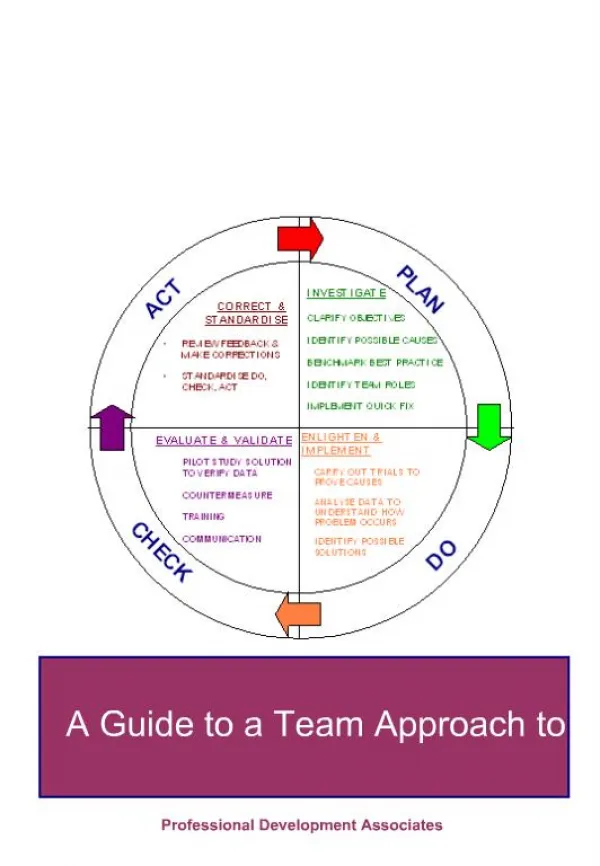
What is PDCA Problem Solving • Originally developed by Walter Shewhart in 1930s. Sometimes referred as “Shewhart Cycle” • Solving problems by finding real root causes • Taking action that permanently removes the problem • Part of the Continuous Improvement methodology • Involves two main strategies • Analysis • Action
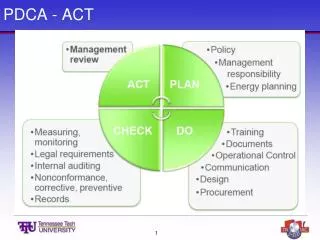
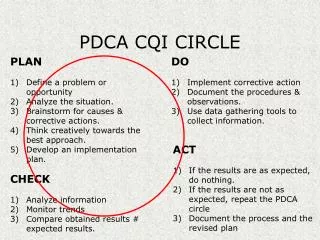
PDCA ACT - Standardize actions - Continue to collect data and verify goals PLAN - Understand gaps between customer’s expectations and what you deliver - Improve process first by analyzing root causes and identify solutions for these problems CHECK - Observe the effect of the change - Collect data to verify changes are working DO - Implement solutions using action planning - Collect data to verify goals
What is Root Cause Analysis? Process to arrive at the preliminary causes of a problem Finding the reason a problem exists and eliminate it with corrective actions Front-end work Defining the problem in quantifiable terms Testing potential root causes Verifying the root cause Common Barriers to Root Cause Analysis Problem described incorrectly Problem solving effort expedited Poor team participation No logical process Permanent corrective action not implemented Over-reliance on experience What is Root Cause Analysis
Starting out right Set meetings, procedures, ground rules Team Membership Who are the other members? Why are they here? What is my role in this team? WIIFM Communications Use a Team Approach Select a team champion Select team members Select team support Are all areas of technical expertise available? Establish time and resources to work on project
Stages of Team Development • The stages include: • Forming • Storming • Norming • Performing • Each stage is unique and each team experiences it in a different way • Things are always changing
Don’t critique ideas Use your imagination Build on others’ ideas Piggybacking Aim for QUANTITY Record each idea Select a facilitator Give everyone 1-2 minutes to silently think about the problem Invite everyone to contribute ideas Write down all ideas Continue until you run out of ideas Discuss and narrow down ideas using Nominal Group Techniqueor Multi-Voting Team Tools: Brainstorming
Plan: Define the Problem Objective: • Review existing data • Specify the internal/external customer problem by identifying in quantifiable terms (who, what, when, where, why, how, how many) for the problem. • Use an “Operational Definition” that has a common meaning to everyone who reads it • Use verifiable criteria • Symptoms are often mistakenly used to describe a problem • Identify the internal/external customer expectations PLAN DEFINE THE PROBLEM DEFINE THE GOAL ROOT CAUSE ANALYSIS IDENTIFY SOLUTIONS
Process Review existing data Get team feedback Go see the problem Identify process flow Ask 5W+2H Are there multiple problems? Is containment required Tools Process Mapping 5W+2H Operational Definition Historical Data & Charts Pareto Chart PDCA Project Status Sheet Plan: Define the Problem
Tools: Current & Historical Data • Customer Feedback • PPM charts, SPC/Run charts • Program Timelines • Test Results • Performance Reports/Feedback • Input-Process-Output (IPO)
Tools: 5W2H Who? Who is the customer complaining? What? What is the complaint or opportunity? When? When did the problem start or occur? Where?Where is the problem observed? Why? Why is this problem occurring (known data)? How? How does the process work? How Many? How many defects?
VALUE What is the relative importance of each part of the problems? What should be the starting point for problem solving? Where should we focus our attention? Tools: Pareto Chart 1st Level Pareto 2nd Level Pareto
Containment Actions • Is Containment Required? • Define and implement containment actions to isolate theeffect of problem from any internal/external customer until corrective action is implemented • Verify the effectiveness of the containment action
Minimize effect of problem on the customer Temporary SOP’s 100% sorting/inspection Do/Perform/Make in-house vs outsource Temporary company policies Additional approvals (signoff) Single source Certified operators/people Common Problems with Containment Actions Considered as permanent solution Costly Easily forgotten Typically only address an effect and not root cause Same problem/effect will surface again Containment Actions
Objective: Identify “What is the end goal” Plan: Define the Goal PLAN DEFINE THE PROBLEM DEFINE THE GOAL ROOT CAUSE ANALYSIS IDENTIFY SOLUTIONS
Process Review data Identify goals that are measurable Does everyone understand? Tools Customer Expectations (Internal/External) Team Tools PDCA Project Status Sheet Plan: Define the Goal
Objective: Identify all potential causes that could explain why the problem occurred Isolate and verify the root cause by testing each potential cause against the problem description Plan: Root Cause Analysis PLAN DEFINE THE PROBLEM DEFINE THE GOAL ROOT CAUSE ANALYSIS IDENTIFY SOLUTIONS
Tools Team Tools Repeated Why Cause & Effect Diagram Check Sheets SPC and Run Charts Histogram Process Flowchart Pareto Chart Scatter Diagram Timeline Root Cause Analysis Worksheet PDCA Project Status Sheet Process Brainstorm additional data requirements Analyze data Identify potential causes Collect data to isolate root causes Select potential root cause Prioritize actions Plan: Root Cause Analysis
Identify Potential Causes • Continue to ask the repeated “Why” statements • List potential root causes • Group discussion / Brainstorming session • Cause and Effect diagram • FMEA • If the problem is new, develop a time line
Tools: Repeated Why WHY?(Because the) WHY?(Because the) WHY?(Because the) WHY?(Because the) WHY?(Because the) Poor Quality Parts Stick to the facts The Problem Statement is…….
Typical Categories Manpower Machine Methods Material Mother nature (Environment) Measurement Tools: Cause and Effect
VALUE What facts or data patterns will help us to better understand the problem and its cause(s) ? How do we translate our « opinions » about the problem into « facts » ? Check sheets are used to capture factual data from the beginning. They are filled by operators to describe the situation following the data collection plan. Tools: Check Sheet Carmen’s World Famous Whoopie Pies Project: June 20-26 Data collected by: Dates: T ypes of defects in 200 Location: Maine plant Lot size: finished pies Defect Total SUN MON TUE WED THU FRI SAT T oo much cream 24 T oo little cream 9 21 T oo crumbly T oo big 13 14 T oo small Not sweet 9 enough Not chocolaty 1 enough Has a bite in it 6
VALUE How frequently does a certain effect occur? What does the frequency distribution look like - a normal curve or some other statistical form ? How frequently is the process outside of specifications ? What is the nature of the deviation outside of specifications, e.g., synthetically or not,... Tool: Histogram Frequency Shaft diameter
Tools: Histogram Normal Distribution Multi-Modal Distribution Bi-Modal Distribution Positively Skewed Negatively Skewed
Tools: Sigma/Distribution Curve 68% 95% 99.7% –3s –2s –1s X +1s +3s +2s
Tools: Sigma/DistributionCurve 68% 95% 99.7% –3s –2s –1s X +1s +3s +2s
VALUE In the variation we observe in a problem characteristic or parameter, what part is natural variation (within the process control limits) and what part is due to specific special causes ? How often does the process go out of control? Are there any discernable trends that should concern us ? Can any preventive actions be taken based on these trends ? Tools: Run Chart / SPC Control chart random variation vs. special events Out of control USL Upper control limit Average Lower control limit LSL Time
Tools: Scatter Diagram 4.5 Positive Correlation Variable 2 4.0 An increase in y may be related to an increase in x. 3.5 x 150 400 650 Variable 1 y 4.5 Negative Correlation 4.0 Variable 2 A decrease in y may be related to an increase in x. 3.5 x 150 400 650 Variable 1 y No Correlation 4.5 There is no demonstrated connection between y and x. Variable 2 4.0 3.5 x 150 400 650 VALUE • Confirm that 2 variables are correlated • What is the nature of the relationship between the variables ?
Objective: Define the best permanent corrective actions Identify measures to ensure the root cause is eliminated Plan: Identify Solutions PLAN DEFINE THE PROBLEM DEFINE THE GOAL ROOT CAUSE ANALYSIS IDENTIFY SOLUTIONS
Tools Team Tools Action Planning Force Field Analysis Cause & Effect Diagram Scatter Diagram Decision Matrix Root Cause Solution Worksheet PDCA Project Status Sheet Process Identify best solutions Verify solutions verses root cause Select best solution Clearly describe solution Determine if simple test is possible Verify measurable Develop Implementation Action Plan Plan: Identify Solutions
Tools: Action Matrix Big Effect on Root Cause Big Payoff/Easy to do Big Payoff/Hard to do PRIORITIZE/PLANTO IPLEMENT THESE DO THESE NOW! HARD EASY DO THESE AFTERDOING EVERYTHING ABOVE SKIP THESE Minimal Benefit/Easy to do Minimal Benefit/Hard to do No Effect on Root Cause
Tools: Force Field Analysis DRIVERS ISSUE RESTRAINERS
Objective: Implement permanent corrective actions Evaluate results of action plan Do: Implement Action Plan IMPLEMENT ACTION PLAN
Process Review action plans Assign responsibilities Implement solutions Conduct training Establish controls Verify measurement Remove containment if necessary Tools Action Planning Worksheet Timelines PDCA Project Status Sheet Do: Implement Action Plan
Tools: Action Planning Worksheet Core Team Member: ______________________________________________________________________________