Download
1 / 72
720 likes | 788 Views
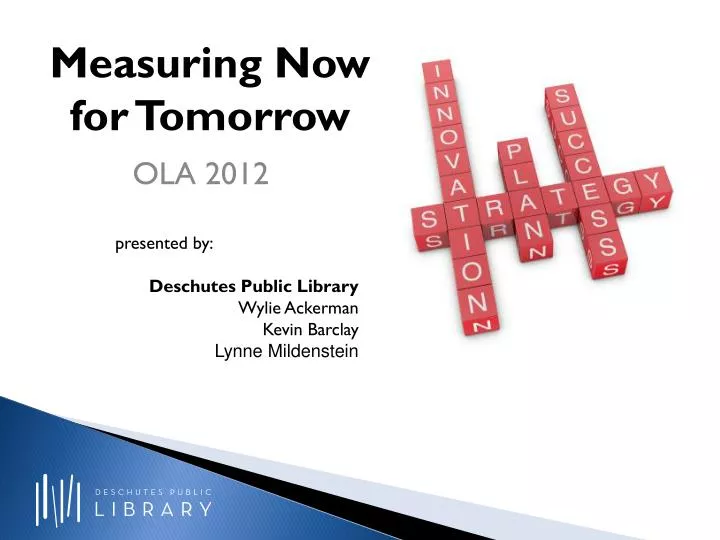
Measuring Now for Tomorrow. presented by: Deschutes Public Library Wylie Ackerman Kevin Barclay Lynne Mildenstein. OLA 2012. Introduction—Why We Measure. State and National Reporting Appropriate allocation of staff and resources Advocacy Efficiencies Awareness of Trends.

E N D
Measuring Now for Tomorrow presented by: Deschutes Public Library Wylie Ackerman Kevin Barclay Lynne Mildenstein OLA 2012
Introduction—Why We Measure • State and National Reporting • Appropriate allocation of staff and resources • Advocacy • Efficiencies • Awareness of Trends
Introduction—Why We Don’t • Think experience is good enough • Time • Lack reliable data source • Lack in-house expertise • Intangibles
Scenarios • Budget Reductions • Operations—Appropriate Allocations of Resources • Review of collections
Collections Statistics—Traditional • Circulation • Turnover • Fill Rate
Circulation Statistics • Methodology – • Count and separate widgets • Count by “audience” types • Count by format • Analysis • Compare national, state, local
Turnover • Methodology • Total circulation ÷ Total holdings = Turnover Rate • National average 3.5 • What about first time use vs. total circulation? • Analysis • Break it down by format • Compare from year to year
Fill Rate Survey Measures satisfaction with collections • Title • Author or Subject • Browsing Why are you at the library? • Programs, Internet, Pick up Hold? • Length of stay
How does it fit? Increase or decrease in circulation….why? Turnover low? Fill rate low? Why?
Collection Statistics—Non-traditional • Circulation/Visits Ratio • Weeding Statistics • Circulation per capita • Collections per capita
Circulation/Visit Ratio • First time checkout / attendance
Weeding • Add vs. weeded • FY 09/10 DPL withdrew 30% more materials than were added • FY 10/11 DPL withdrew 44% more materials than were added “A good library collection is like a good haircut. It’s not what you cut—it’s what you leave” Anne Felix, Grand Prairie (Texas) Public Library System
Staffing and Service Statistics • Service Desk Tally • Staffing Standards • Check-ins • Visit/hour • Self-check percent
Service Desk Tally—Customer Transactions • Methodology • Analysis • DPL Approach
Staffing Standards I—Minutes/Check-in and Service Minutes/Visit
Self-Check Percent • Methodology • Analysis • DPL Approach
Facilities Statistics • Facility per Service Area Capita • Computer Usage • Hourly Circulation Activity • Cost/square foot • Cost/Service Area Capita • PC/Internet/Wireless usage/Cost
Computer Usage • Methodology • Analysis • DPL Approach
PC/Internet/Wireless Usageand Cost • Methodology • Analysis • DPL Approach
Now What?—What do these numbers tell you about your staffing and facilities? • Allocation (Right staff for the right job) • Open Hours • New facilities • Outreach vsInreach
eServices • Digital • Subscription Databases • Web • Social Media • eServices Users
DigitalOverDrive • What useful data do we have access to? • What does it tell us? • What data are we missing?
DigitalOverDrive What else can you measure? • % of collection out at any given time • Number of holds/requests • Turnover rate • Title Statistics (which titles are most popular)