Ocean Color Remote Sensing from Space
320 likes | 475 Views
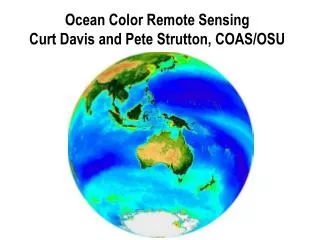
Ocean Color Remote Sensing from Space. Lecture in Remote Sensing at 7 May 2007. Astrid Bracher. Room NW1 - U3215 Tel. 8958 bracher@uni-bremen.de www.iup.uni-bremen.de/~bracher. Basic principles of Ocean Color Remote Sensing. (Doerffer et al. 2006). Absorption, Scattering and Beam Attenuation.

Ocean Color Remote Sensing from Space
E N D
Presentation Transcript
Ocean Color Remote Sensing from Space Lecture in Remote Sensing at 7 May 2007 Astrid Bracher Room NW1 - U3215Tel. 8958bracher@uni-bremen.dewww.iup.uni-bremen.de/~bracher
Basic principles of Ocean Color Remote Sensing • (Doerffer et al. 2006)
Spectral color and wavelength in Nanometer [nm= m-9] Attenuation by water and water constituents awas = absorption by water kwas = attenuation by water ksus = attenuation by suspended particles kwas = attenuation by phytoplankton kgelb = attenuation by yellow substance (dissolved organic matter) (Modelled with SIRTRAM by Doerffer 1992)
Marine Phytoplankton • Global Contribution: • Plant biomass 1-2% • Primary production ~50% • Functional Groups: • Build-up of biominerals • (e.g. silicate by diatoms) • Calcifiers (e.g. Emiliania) • Cloud formation (via DMSP: Phaeocystis) • Nitrogen-Fixation (blue algae) • Toxic Algae • Falkowski et al. Science, 2004
True Color • from • SeaWiFS Climate Change and Phytoplankton Composition: Bering Sea: extraordinarily warm summer 1997– the first time ever bloom of calcifying algae • (Napp et al. 2001)
Phytoplankton 0.05 0.04 0.03 0.02 0.01 0 ---- low chl a, mainly Picoplankton ---- diatom bloom ----Phaeocystis bloom • MERIS • SeaWiFS Spec. phytoplankton absorption [m2/mg] • Bracher & Tilzer 2001 400 450 500 550 600 650 400 450 500 550 600 650 700 wavelength [nm] Absorb light by pigments (chlorophylls, carotenoids,...) Pigments are excited Excitation energy used in photosynthesis to make O2 & organic compounds Basis for marine ecosystem and carbon cycle Phytoplankton absorption variable among species and location! photoacclimation and community composit.
Downwelling irradiance attenuation coefficient Green: 5 mg/l Total Suspended Matter (TSM), 5 µg/l chl a (phytoplankton), yellow substance ag440= 0.4 m-1 Green: 5 mg/l Total substanc Green: 5 mg/l Total substa m-1 Blue: 0.1 µg/m-3 chl a • (Doerffer et al. 2006)
Signal depth z90 = 1/k Coastal waters (= case-2) Blue-green: 5 mg/l TSM, 5 µg/l chl a, ag440= 0.4 m-1 Open Ocean (= case-1) Blue: 0.1 µg/m-3 chl a • (Doerffer et al. 2006)
Absorption spectra in case 1 waters for water, yellow substance and phytoplankton In case-1 waters: attenuation dominated by phytoplankton, ratio of yellow substance conc. to chl a is constant while it is not for case-2 (=coastal) waters Empirical Model for phytoplankton biomass from remote sensing for case-1 waters
Comparison of ratio of Reflectances (at 445 nm to 555 nm) to phytoplankton biomass (chl a) measurements Morel & Antoine MERIS ATBD
MERIS – Median Resolution Imaging Spectrometer- Ocean Color Sensor Other Ocean Color Sensors: Coastal-Zone-Color-Scanner (1978-1986), SeaWiFS (1997-), Modis (1999- on TERRA, 2002- on AQUA) MOS, POLDER, GLI, OCTS
MERIS – Median Resolution Imaging Spectrometer- Ocean Color Sensor
MERIS true color picture: A large aquamarine-coloured plankton bloom streches across the length of Ireland in the North Atlantic Ocean
MERIS global chl a (phytoplankton biomass) distribution from algorithm using Rrs[443] / Rrs[560]
Water leaving Radiance Reflectance Spectra of North Sea water with first 10 MERIS spectral bands Chl a from ocean color: Ratio of reflectance at certain wavebands (blue /green) But: Differences in phyto- plankton absorption photoacclimation + species composition Requires higher spectral resolution!
Limited data base on specific phytoplankton absorption (in situ measurements) primary production modeling: Directly affected: light actually absorbed Indirectly: influences chl a retrieval from ocean color data Global Models on Marine Primary production • Function of fixed organic carbon to biomass (chl a) & light • Use data of ocean color satellite sensors (MERIS, MODIS, SeaWIFS,…) on chl a, surface water reflectance and light penetration depth • Rarely consider spectral dependency of photosynthesis Phytoplankton absorption and major phytoplankton groups from space using highly spectrally resolved remote sensing data!
SCIAMACHY • (Scanning Imaging Absorption Spectrometer for Atmospheric Cartography) • UV-VIS-NIR spectrometer on Envisat since 2002 in orbit • 8 high resolution and 6 polarization channels • measures transmitted, reflected and scattered sunlight • wavelength coverage 220 – 2380 nm at 0.24-1.48 nm resolution • global information within 6 days, >30 km X >30 km resolution Delivers information on: -distributions of geophysical parameters in atmosphere from 0-100 km ozone depletion, greenhouse effect, air pollution, climate change - but now on ocean optics: phytoplankton, vibrational raman scattering
Processing of SCIAMACHY nadir spectra with DOAS • DOAS = Differential Optical Absorption Spectroscopy (Perner and Platt, 1979) • Uses differential absorption signalof the molecular absorber in the earthshine spectrum wrt. extraterrestrial solar irradiance • Ratio Earthshine / Solar irradiance removes instrumental and Fraunhofer features • Input: Absorption cross section for each molecular species in spectral interval • Least squares fit of DOAS equation based on Beer`s law to observations • Separation of high- and low frequency absorption features by low order polynomial • Output: Slant column density SCD = number of molecules along average photon path
DOAS fit from 430 to 500 nm - included in analysis: O3, NO2, H2O (both vapor and liquid), Ring and differential phytoplankton absorption spectrum measured in situ Phytoplankton absorption from hyperspectral sensor SCIAMACHY • Differential phytoplankton absorption at high chl a --- reference spectrum from in-situ meas. of mixed population (by Bracher & Tilzer 2001) __ DOAS-fit with SCIAMACHY meas. Clear differential signal from phytoplankton pigments!
DOAS fit of phytoplankton pigment absorption from 430 to 500 nm in vivo Phytoplankton Absorption Chl a Standard Absorption (mixed population, dominated by <20µm) from Bracher and Tilzer 2001 Specific In vivo reference spectra yield much better fits than chl a Clear differential signal from phytoplankton pigments!
Global Phytoplankton Absorption Fits from SCIAMACHY SCIAMACHY DOAS-Fits of phytoplankton absorption • Compared to • MODIS chl a level-3 product • Monthly Average: 15.Oct-14.Nov 2005 Schl (Fit-Factor) http://oceancolor.gsfc.nasa.gov Bracher et al. 2006 Schl = slant column of specific phytoplankton absorption Strong correlation to ocean color chl a !
Vibrational Raman Scattering (VRS) from SCIAMACHY VRS always accompanied by an elastic scattering process Proxy for light penetration depth (δ) (transformation to λ of phytoplankton absorption fit) • Averages over July 2005 --- model __ SCIA meas. • High sensititvity of VRS fit • at low chl a • Vountas et al. submitted to Ocean Sciences
Phytoplankton biomass from Ocean color • SCIAMACHY chl a conc. c • from DOAS-Fits of phytopl. absorption • (mixed community) and VRS: C = Schl / δ http://www.enviport.org/meris • Vountas et al. submitted First SCIAMACHY phytoplankton biomass determined with DOAS (whole spectrum fit) shows good visual agreement to MERIS algal-1 chl a product