Download
1 / 40
410 likes | 557 Views
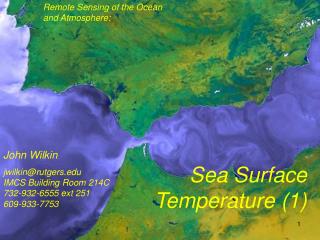
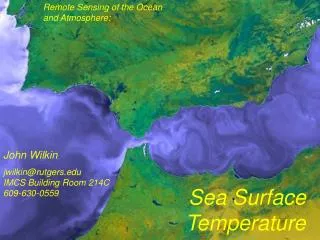
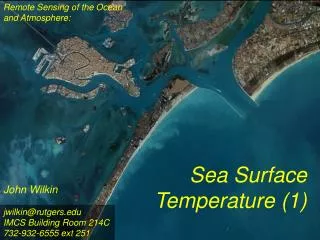
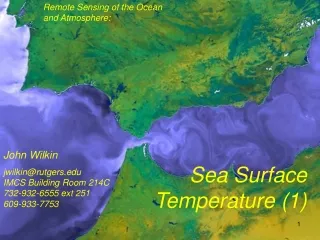
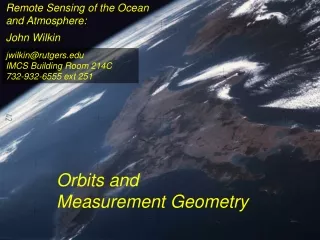
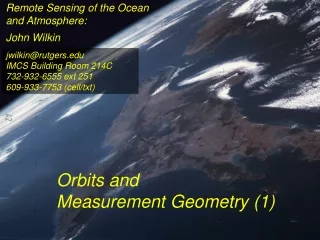
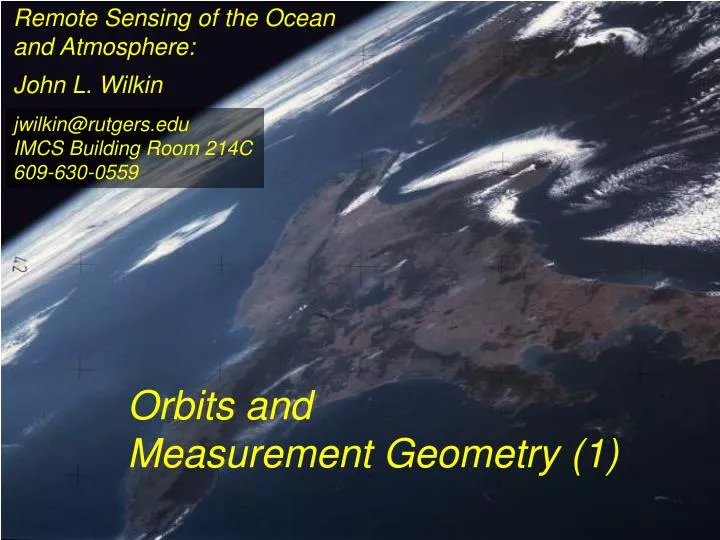
Remote Sensing of the Ocean and Atmosphere:. John L. Wilkin. jwilkin@rutgers.edu IMCS Building Room 214C 609-630-0559. Orbits and Measurement Geometry (1).

E N D
Remote Sensing of the Oceanand Atmosphere: John L. Wilkin jwilkin@rutgers.eduIMCS Building Room 214C609-630-0559 Orbits and Measurement Geometry (1)
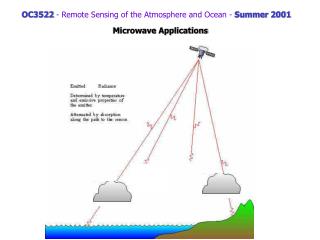
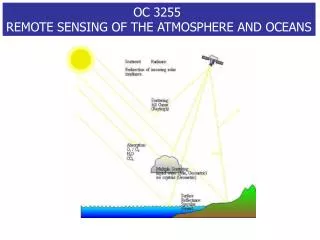
The flow of information from land or sea surface to satellite to user depends on features of the land/ocean phenomena, the observing system, and the intervening atmosphere. (3) Sensor: the data is a measurement or image (4) resolution: FOV, aperture, scan geometry can depend on satellite trajectory and altitude (orbit), pointing (2) Water leaving signal: WLR can depend on relative position of sun and satellite, time of day, emissivity, reflectance (5) Geolocation: position, time, pointing. Orbit affects repeat sample interval (6) Position of the satellite, or range to target may be the actual data. (1) Ocean phenomena: color, temperature, roughness, height
Johannes Kepler (1571 – 1630) German mathematician, astronomer and astrologer • Planets move in elliptical orbits with the sun as one focus • the radius vector from the sun to the planet sweeps out equals areas in equal times • T2 : R3 ratio is constant for all planets, where T is orbital period and R is semi-major axis of the orbit
Galileo Galilei (1564 - 1642)Italian physicist, mathematician, astronomer, and philosopher Galileo's pupil Vincenzo Viviani stated that Galileo had dropped balls of the same material, but different masses, from the Leaning Tower of Pisa to demonstrate that their time of descent was independent of their mass. This was contrary to what Aristotle had taught: that heavy objects fall faster than lighter ones, in direct proportion to weight. There is no account by Galileo himself of such an experiment, and it is generally accepted that it was at most a thought experiment which did not actually take place.
Isaac Newton (1643 - 1727) English physicist, mathematician, astronomer, theologian • Newton discovered the laws of gravitation and explained planetary and satellite orbits in terms of the balance of forces: • Centripetal acceleration • Gravity
v2 v2 change in velocity (acceleration) is perpendicular to the direction of travel v1 -v1 Δv Δθ Δs = rΔθ Δθ
Examples of low-inclination low-earth orbits are the ISS and HST
x-axis Stewart, R. H., 1985, Methods of Satellite Oceanography, University of California Press, 360 pp.
Right ascension - declination coordinate system First Point of Aries: One of the two points on the Celestial Sphere where the Ecliptic and the Celestial Equator cross one another. Ecliptic: An imaginary line in the sky that approximates the plane in which the planets orbit the Sun. From the perspective of an observer on Earth, the planets and the Sun will always remain close to this line. When the Sun reaches the First Point of Aries, as it does once each year, the Northern hemisphere Vernal Equinox occurs. The First Point of Aries, which is actually in Pisces, defines the zero-point for Right Ascension. Right ascension: the celestial equivalent of longitude (starting at the First Point of Aries) Declination: the celestial equivalent of latitude The celestial north pole is at declination +90
http://spaceflight.nasa.gov/realdata/elements • See graphics of orbital elements and data for ISS
Jason-1 launch from Vandenburg Air Force Base, California Launch: ** http://www.youtube.com/watch?v=Z4WHOSF2Ktg Other launches: Delta-II (Themis):http://www.youtube.com/watch?v=p_pAhPecto0 Ariane launch failure: http://www.youtube.com/watch?v=kYUrqdUyEpI Jason-2 OSTMhttp://www.youtube.com/watch?v=cf0loVEs_lo Pegasus vehicle aircraft launch http://www.youtube.com/watch?v=QRHiTvRHHd8 Space craft separation: http://www.youtube.com/watch?v=1aBpcCVljt4
OSTM / Jason-2 Boost Profile Space craft separation: http://www.youtube.com/watch?v=1aBpcCVljt4
Remote Sensing of the Ocean and Atmosphere: John L. Wilkin jwilkin@rutgers.eduIMCS Building Room 214C609-630-0559 (g-voice) Orbits and Measurement Geometry (2)
Hohmann Transfer Maneuver to different inclination http://en.wikipedia.org/wiki/Hohmann_transfer
http://www.nytimes.com/2007/02/06/science/space/06orbi.html?emc=eta1http://www.nytimes.com/2007/02/06/science/space/06orbi.html?emc=eta1 Collisions between existing debrisgenerate additional pieces of debris.There is concern that eventually a chainreaction will ensue (the Kesslersyndrome) littering the low earth orbit(LEO) with debris making it almostimpenetrable to new satellite launches forfear of collision. http://www.nytimes.com/2007/02/06/science/20070206_ORBIT_GRAPHIC.html Kessler, D. J., and Burton G. Cour-Palais. "Collision frequency of artificial satellites – The creation of a debris belt." Journal of Geophysical Research Vol. 83 (June 1978): 2637-2646.
Semi-major axis = Rearth + orbit height = 6371 + 1366 km = 7737 km i = 66o
3122 km 245 km = 316 cos (39)
ENVISAT 35-day repeat Jason altimeter satellite 10-day exact repeat.Equatorial separation of Jason ground-tracks is 316 km
Sidereal day = time it takes for Earth to rotate through 360o This is slightly shorter than a solar day (24 hours) There are 365.25 solar days in a year but 366.25 sidereal days Sidereal day = 365.25/366.25*24 = 23.93 hours solar sidereal Sun synchronous orbit exploits intentional precession of orbital plane http://en.wikipedia.org/wiki/Sidereal_time
SeaWiFS daily coverage seawifs_daily_coverage animation Sun-synchronous orbit altitude = 7228 km Semi-major axis = Rearth + alt = 7228 km Is this orbit prograde or retrograde?
Terra satellite, MODIS instrument, coverage of all instrument swaths during a single day ( 01/28/2006 )
http://aquarius.nasa.gov/ Sun synchronous terminator orbit The sun is a significant source of L-band radiation, so Aquarius antenna points toward night-time side of orbit to avoid reflection from the ocean surface
Molniya orbit • Highly elliptical: eccentricity = 0.72 • Semi-major axis = 26,554 km • Spends a long time over one hemisphere • Used for communications at high latitudes (Russia in particular) because equatorial geostationary has poor coverage at high latitude. • Used for spy satellites and ICBM early warning surveillance with an orbit that dwells over the US • With inclination 63.4 will precess (like sun-synchronous) to maintain apogee over a desired ground point • Molniya orbits require more rocket power to achieve than geosynchronous • Period is 12 hours so there are two regions on the earth surface that receive repeated visits • The related tundra orbit has a period of 24 hours so its apogee point is unique on the earth surface – this tundra orbit is used by Sirius Satellite Radio In Orbit Architect: e = 0.72 Semi-maj axis = 26,500 Arg. perigee = 296 Adjust RAAN to place orbit over region of interest
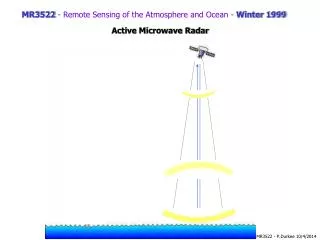
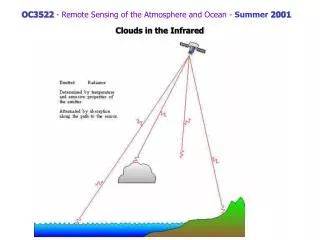
Scan geometry • zenith angle w.r.t. satellite nadir • look angle and solar zenith angle w.r.t local vertical • Fixed solid angle Field of View (FOV) such as for an optical lens, gives elliptical footprint off-nadir and varying spatial resolution in the scan
Sun glint shows atmospheric gravity waves modifying ocean surface roughness On its descent into the wave trough, the air roughens the water surface and the surface appears dark. The brighter regions show the crests of the atmospheric waves where the water is calm and reflects light directly back towards the sensor. Clouds commonly form at the crests of the waves and are visible throughout this scene.
Panoramic distortion NOAA AVHRR Pixels 2.89 times bigger if earth flat
Panoramic distortion NOAA AVHRR Pixels 2.89 times bigger if earth flat Pixels 4.94 times bigger if earth round
“Whisk-broom” e.g. MODIS “Push-broom”
http://maracoos.org/irene/wp-content/uploads/2011/08/2011.08.29.1513.Terra_.RGB_.mab_.jphttp://maracoos.org/irene/wp-content/uploads/2011/08/2011.08.29.1513.Terra_.RGB_.mab_.jp MODIS is a 55 deg +/- whisk broom scanner Mirror side stripe (banding) is a sudden change of bias level of all detectors. The change occurs during the scan mirror’s turnaround, and the amount of change is quite constant. The image appearance is slightly brighter and darker scans (clearly seen in homogeneous areas such as oceans)
2011-Aug-19 MODIS/Aqua
Internet resources on orbits and satellites Unusual orbits (especially ground track) • Chandra • IMAGE • CRRES (in a geosynchronous transfer orbit) • Tundra • Molniya • http://heavens-above.comShows predicted orbits and visibility magnitudes and star charts of pass trajectories for all satellites • See Homework 1 http://tinyurl.com/11-670-451-homework-1 • http://spaceflight.nasa.gov/realdata/elements • See graphics of orbital elements and data for ISS • Real-time satellite tracking at http://www.n2yo.com