Download
1 / 78
840 likes | 1.21k Views
MEASUREMENT. Accuracy, Precision, Percent Error, Precision of Measurement, Significant Figures, & Scientific Notation 101. Learning Objectives.

E N D
MEASUREMENT Accuracy, Precision, Percent Error, Precision of Measurement, Significant Figures, & Scientific Notation 101
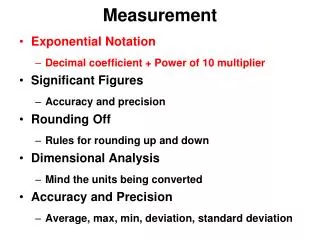
Learning Objectives • The Learners Will (TLW) collect data and make measurements with accuracy and precision, and will be able to calculate percent error and precision of measurement (TEKS 2.F) • TLW be able to express and manipulate quantities and perform math operations using scientific notation and significant figures (TEKS 2.G)
Agenda • Part 1 – Units of Measurements • A. Number versus Quantity • B. Review SI Units • C. Derived Units • D. Problem Solving • Part 2 – Using Measurement • A. Accuracy vs. Precision • B. Percent Error • C. Precision of Measurement • D. Significant Figures • E. Scientific Notation • F. Using Both Scientific Notation & Significant Figures
A. Number vs. Quantity • Quantity = number + unit UNITS MATTER!!
B. SI Units Quantity Symbol Base Unit Abbrev. Length l meter m Mass m kilogram kg Time t second s Temp T Kelvin or Centigrade K or C Amount n mole mol
mega- kilo- k M 106 103 BASE UNIT deci- --- d 100 10-1 centi- c 10-2 milli- m 10-3 micro- 10-6 nano- n 10-9 pico- p 10-12 B. SI Units Prefix Symbol Factor
M V D = C. Derived Units • Combination of base units. • Volume (m3 or cm3) • height width length 1 cm3 = 1 mL 1 dm3 = 1 L • Density (kg/m3 or g/cm3) • mass per volume
D. Problem-Solving Steps 1. Analyze - identify the given & unknown. 2. Plan - setup problem, use conversions. 3. Compute -cancel units, round answer. 4. Evaluate - check units, use sig figs.
WORK: D = M V D = 25 g 29 mL D. Problem Solving Example – Density • A liquid has a volume of 29 mL and a mass of 25 g? What is the density? GIVEN: V = 29 mL M = 25 g D = ? D = 0.87 g/mL
D. Problem Solving Example – Density • An object has a volume of 825 cm3 and a density of 13.6 g/cm3. Find its mass. GIVEN: V = 825 cm3 D = 13.6 g/cm3 M = ? WORK: M = DV M = 13.6 g/cm3 x 825cm3 M = 11,200 g
Let’s Experiment… • Measure the level in the two graduated cylinders • Measure of the level in the beaker • Write your name on the chart at the front of the room and record the above measurements in the columns indicated
Actual Measurement in each is _8.3___ • How close to the actual measurement is our data? • How close are our readings to one another? • What could account for the differences in your own measurements? • What could account for the differences between your readings and those of your classmates?
A. Accuracy vs. Precision • Accuracy - how close a measurement is to the accepted value (published, target) • Precision - how close a series of measurements are to each other ACCURATE = CORRECT PRECISE = CONSISTENT
A. Accuracy vs. Precision • PRECISE – a golfer hits 20 balls from the same spot out of the sand trap onto the fringe of the green. Each shot is within 5 inches of one another. Wow – that’s CONSISTENT • ACCURATE – the golfer’s 20 shots aren’t very accurate, because they need to be much closer to the hole so she can score easily – that would be CORRECT
Audience Participation Let’s Play The Accuracy? or Precision? Game
your value accepted value B. Percent Error • Indicates accuracy of a measurement obtained during an experiment as compared to the literature * value (* may be called accepted, published, reference, etc.) • Error is the difference between the experimental value and the accepted value
For our purposes a percent error of < 3% is considered accurate • In the real world, percent error can be larger or smaller. • Considering the following areas that need much smaller percents of error • Landing an airplane • Performing heart surgery
% error = 2.9 % B. Percent Error • A student determines the density of a substance to be 1.40 g/mL. Find the % error if the accepted value of the density is 1.36 g/mL.
B. Percent Error • In groups of 2 calculate the percent error • Raise your hand when your team is done 1. Experimental Value = 5.75 g Accepted Value = 6.00 g 2. Experimental Value = 107 ml Accepted Value = 105 ml 3. Experimental Value = 1.54 g/ml Accepted Value = 2.35 g/ml
Let’s Experiment… • Measure the wooden block with the metric measuring stick • Bring measurement of the level in the two graduated cylinders • Bring measurement of the level in the beaker • Write your name on the chart at the front of the room and record the above measurements in the columns indicated
Lab Results • Did we all come up with exactly the same numbers? • Why or Why not? • Which are most precise measurements? • Why? • Which are most accurate measurements? • Why? • What is the percent error? • Perform the calculations
C. Precision of Measurement • Even the best crafts people and finest manufacturing equipment can’t measure the exact same dimensions every time • Precision of Measurement determines the spread from average value (tolerance)
Precision of Measurement • “Tolerance” is used constantly in manufacturing and repair work • Example – parts for autos, pumps, other rotating equipment can have a small amount of space between them. • Too much and the parts can’t function properly so the equipment won’t run • Too little and the parts bind up against each other which can cause damage
Precision of Measurement • To calculate precision of measurement: • Average the data • Determine the range from lowest to highest value • Divide the range by 2 to determine the spread • Precision of measurement is expressed as the average value +/- the spread • Smaller the spread the more accurate and precise the measurement • You may have a spread that has 1 more significant figure that original values
Precision of Measurement Gap Between Piston & Cylinder 0.60 μm 0.62 μm 0.59 μm 0.60 μm 0.65 μm 0.60 μm 0.58 μm Total = 4.24 μm • Average (mean) = Total No. of samples 4.24 μm / 7 = 0.61 μm • Range = highest – lowest 0.65 μm – 0.58 μm = 0.07 μm • Spread = Range / 2 0.07 μm / 2 = 0.035 μm • Precision of Measurement = Average +/- Spread 0.61 μm +/- 0.035 μm
Precision of Measurement – Let’s Practice Together • Given the following volume measurements: 5.5 L 5.8 L 5.0 L 5.6 L 4.8 L 5.2 L • Determine Precision of Measurement: • Average: L • Range: L • Spread: L • Precision of Measurement L + / - L
Precision of Measurement – Practice in Pairs • Determine Precision of Measurement for: 6.25 m 6.38 m 6.44 m 6.80 m • Determine Precision of Measurement for: 80.6 g 81.3 g 80.5 g 80.8 g 80.2 g 81.1 g
Check for Understanding • Accuracy – Correctness of data • Precision – Consistency of results • Percent Error – Comparison of experimental data to published data • Precision of Measurement – Determining the spread from average value (tolerance)
Check for Understanding • How can you ensure accuracy and precision when performing a lab? • What is the percent error when lab data indicates the density of molasses is 1.45 g/ml and Perry’s Handbook for Chemical Engineering shows 1.47 g/ml?
Independent Practice • Accuracy and Precision Worksheet 1
C. Significant Figures • As we experienced first hand from our lab, obtaining accurate and precise measurements can be tricky • Some instruments read in more detail than others • If we have to eyeball a measurement we can each read something different, or we can make an error in estimating
C. Significant Figures • Measuring… Sig Figs and the Role of Rounding • TeacherTube Video Clip – Why Are Significant Figures Significant?
C. Significant Figures • Indicate precision of a measurement • Recording Sig Figs (sf) • Sig figs in a measurement include the known digits plus a final estimated digit • Sig figs are also called significant digits 2.33 cm
C. Significant Figures • The Pacific/Atlantic Rule to identify significant figures • Let’s go over a few examples together • Then we’ll practice independently
C. Significant Figures • Gory details and rules approach
C. Significant Figures • All non-zero digits are significant. • Zeros between two non-zero digits are significant. -- 2.004 has 4 sf. • Count all numbers EXCEPT: • Leading zeros -- 0.0025 • Trailing zeros without a decimal point -- 2,500 (Trailing zeros are significant if and only if they follow a decimal as well)
C. Significant Figures • Zeros to the right of the decimal point are significant. 20.0 has 3 sf. • A bar placed above a zero indicates all digits including one with bar and those to the left of it are significant. 210 has 3 sf. • When a number ends in zero and has a decimal point, all digits to the left of the decimal pt. are significant. 110. has 3 sf.
C. Significant Figures • Exact Numbers do not limit the # of sig figs in the answer. • Counting numbers: 12 students • Exact conversions: 1 m = 100 cm • “1” in any conversion: 1 in = 2.54 cm • Constants – such as gravity 9.8 m/s2 or speed of light 3.00 m/s • Number that is part of an equation (for example area of triangle 1/2bh) • So, sig fig rules do not apply in these cases!!!!!
C. Significant Figures • Zeros that are not significant are still used • They are called “placeholders” • Example – • 5280 ~ The zero tells us we have something in the thousands • 0.08 ~ The zeros tell us we have something in the hundredths
C. Significant Figures Counting Sig Fig Examples 1. 23.50 1. 23.50 4 sig figs 3 sig figs 2. 402 2. 402 3. 5,280 3. 5,280 3 sig figs 2 sig figs 4. 0.080 4. 0.080
Significant Figures - Basics • Independent practice – Problem Set 1 link
3 SF C. Significant Figures • Calculating with Sig Figs • Multiplying / Dividing - The number with the fewestsig figs determines the number of sig figs in the answer. (13.91g/cm3)(23.3cm3) = 324.103g 3 SF 4 SF 324g
C. Significant Figures • Calculating with Sig Figs • Adding / Subtracting - The number with the fewest number of decimals determines the place of the last sig fig in the answer. • If there are no decimals, go to least sig figs. 224 g + 130 g 354 g 224 g + 130 g 354 g 3.75 mL + 4.1 mL 7.85 mL 3.75 mL + 4.1 mL 7.85 mL 350 g 7.9 mL
5. (15.30 g) ÷ (6.4 mL) 2.4 g/mL 2 SF C. Significant Figures Practice Problems 2 SF 4 SF = 2.390625 g/mL 6. 18.9 g - 0.84 g 18.1 g 18.06 g
C. Significant Figures • One more rule…. • Be sure you maintain the proper units • For example – you can’t add centimeters and kilometers without converting them to the same scale first • 1 m = 100 cm • 4.5 cm + 10 m = 4.5 cm + 1000 cm = 1004.5 cm 1005 cm
C. Significant Figures • When adding and subtracting numbers in scientific notations: • You must change them so that they all have the same exponent (usually best to change to largest exponent) • Then add or subtract • Round answer appropriately according to proper significant figure rules • Put answer in correct scientific notation
C. Significant Figures • When multiplying numbers in scientific notations: • Multiply coefficients, then add the exponents • When dividing numbers in scientific notations: • Divide coefficients, then subtract the exponents • For Both • Round answer appropriately according to proper significant figure rules • Put answer in correct scientific notation
C. Significant Figures • Exception to Rule • The rule is suspended when the result will be part of another calculation. • For intermediate results, one extra significant figure should be carried to minimize errors in subsequent calculations.