Measurement
580 likes | 1.27k Views
Measurement. Module 1: Measurements & Error Analysis. Module Objectives. Define ‘measurement’. Give examples of measurement applications in the physical world. Identify measurement elements. Differentiate between the types of measurement. Differentiate between systematic and random errors.

Measurement
E N D
Presentation Transcript
Measurement Module 1: Measurements & Error Analysis
Module Objectives • Define ‘measurement’. • Give examples of measurement applications in the physical world. • Identify measurement elements. • Differentiate between the types of measurement. • Differentiate between systematic and random errors. • Perform statistical error analysis on a set of measurements. • Define the major characteristics of an instrument/device and determine them through experiments. • Describe the concept of ‘calibration’.
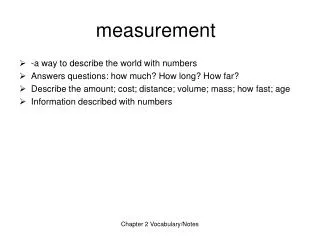
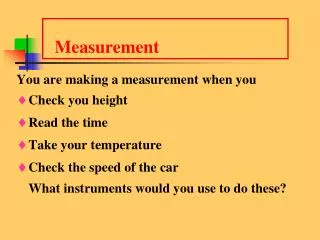
Introduction to Measurement • What do we measure? • Physical dimension of an object • Count of objects • Temperature of an object • Fluid pressure/flow rate/volume • Electrical voltage, current, resistance • Machine position/speed and so on.
Measurement - Definition • Measurement is the process of determining the magnitude of a physical quantity such as length or mass, relative to a standard unit of measurement, such as the meter • It could also be defined as ‘the comparison between a standard and a physical quantity to produce a numeric value’
Activity • Find the meaning of standard unit, physical quantity and numeric value
The measuring devices could be sensors, transducers or instruments. • ruler - length; • thermometer - temperature; • light dependent resistor (LDR) - light intensity
Questions • Physical quantity: ___________________ • Measuring device: ___________________ • Numeric value: _____________________ • Standard unit: _____________________
Questions • Physical quantity: ___________________ • Measuring device: ___________________ • Numeric value: _____________________ • Standard unit: ______________________
Online Activity: • http://kent.skoool.co.uk/content/keystage3/Physics/pc/learningsteps/FCDLC/launch.html
Measurement Types • Two basic methods of measurement : • Direct Measurement • Indirect Measurement
Direct Measurement • the physical quantity or parameter to be measured is compared directly with a standard
Indirect Measurement • the physical quantity (measurand) is converted to an analog form that can be processed and presented. (Obtained by measuring other quantities.) • E.g. the mercury in the mercury thermometer expands and contracts based on the input temperature, which can be read on a calibrated glass tube.
Error definition • Error = Instrument reading – true value.
Error types • Systematic Error • Random Error
Activity Difference between Systematic Error and Random Error
Systematic Error • Happens because of: • zero error of the instrument, • the shortcomings of the sensor, • improper reading of the instrument due to the improper position of the person’s head/eye (Parallax error), • the environmental effect, • Can be corrected by calibration
Random errors • errors that result in obtaining different measured values when repeated measures of a physical quantity are taken. • E.g.measuring the mass of gold on an electronic scale several times, and obtaining readings that vary in a random fashion • reasons for random errors are not known and therefore they cannot be avoided. • They can only be estimated and reduced by statistical operations.
Error Analysis • The two most important statistical calculations that could be used for the analysis of random errors are • average or mean • standard deviation
Objective • Perform statistical error analysis on a set of measurements. • Define the major characteristics of an instrument/device and determine them through experiments. • Describe the concept of ‘calibration’.
Warm Up • What is measurement? • Measurement is the process of determining the magnitude of a physical quantity such as length or mass, relative to a standard unit of measurement
Warm-up • Name two basic methods of measurements • Direct Measurement • the physical quantity or parameter to be measured is compared directly with a standard • Indirect Measurement • the physical quantity (measurand) is converted to an analog form that can be processed and presented
Warm up Physical Parameters Numeric value Measuring device Standard
Define error? • Error = Instrument reading – true value
Warm up • Give two error types: • Systematic Error • Random Error
Name the error • Can we correct the error? Parallax Error Zero Error
What is random error? • errors that result in obtaining different measured values when repeated measures of a physical quantity are taken. • How do we reduce the error? • statistical operations – mean, Standard deviation • Give example
Mean/ Average • The average/mean gives an estimate of the ‘true’ value.
Example: Mean • suppose the mass of gold was recorded at different instants as in the table • The mean/average???
Standard Deviation • Symbol is ‘σ’ • Shows how much the individual readings deviate or differ from the average/mean of the set of readings.
Example: SD • For the set of readings 16, 19, 18, 16, 17, 19, 20, 15, 17 and 13 the mean value or average is ??
Formula for SD • Standard deviation, • σ = √sum/(n-1) • ‘n’ is the number of terms.
Exercise • Suppose a lab refrigerator holds a constant temperature of 38.0 F. Two groups of students are taking the reading for 10 times in each group. The temperatures from the test yield the temperatures of as shown below. • Group A: 39.4, 38.1, 39.3, 37.5, 38.3, 39.1, 37.1, 37.8, 38.8, 39.0. • Group B: 37.8, 38.3, 38.1, 38.0, 37.6, 38.2, 38.0, 38.0, 37.4, 38.3
Activity • Find any information on the following from the internet: • Precision • Accuracy • Range • Sensitivity • Linearity
Precision: • The ability of an instrument to give the similar reading when the same physical quantity is measured more than once. • The closer together a group of measurements are, the more precise the instrument. • A smaller standard deviation result indicates a more precise measurement.
Accuracy • Accuracy of an instrument is how close a measured value is to the true value. • The measurement accuracy is calculated using the percentage error formula. • % Error =
Range: • The range of an instrument defines the minimum and maximum values that the instrument can measure. Example: • The maximum reading of the thermometer is: 120o F • The minimum reading of the thermometer is: 40o F • Range= Maximum reading – Minimum reading • = 120 -40 • = 80o F
Sensitivity: • The sensitivity of a measuring instrument is its ability to detect small changes in the measured quantity. • Sensitivity = Change in Output / Change in Input
Linearity • Some measuring instruments/devices output a signal that is proportional to the input physical quantity. These instruments are called linear devices. • Other instruments that don’t have a proportional relationship between the output signal and the input are non-linear devices.
Calibration • Calibration is a process of comparing the performance of an instrument/device with a standard. • Calibration could be performed by holding some inputs constant, varying others, recording the output(s), and developing the input-output relations. • The relationship between the input and the output is given by the calibration curve.