Download
1 / 15
150 likes | 253 Views
Warm-up 8.3 and 8.4 C.I.and Inference Test of two Ind. Proportions. 1. Consider two events: E and F . We know that P ( E ) = P ( F ) = 0.7. Are the two events E and F disjoint? A) Yes. B) No, because P ( E ) and P ( F ) are equal.

E N D
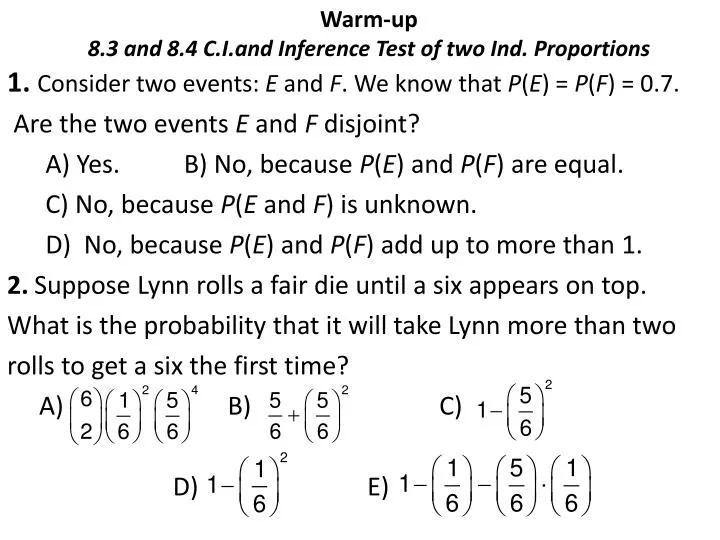
Warm-up8.3 and 8.4 C.I.and Inference Test of two Ind. Proportions 1. Consider two events: E and F. We know that P(E) = P(F) = 0.7. Are the two events E and F disjoint? A) Yes. B) No, because P(E) and P(F) are equal. C) No, because P(E and F) is unknown. D) No, because P(E) and P(F) add up to more than 1. 2. Suppose Lynn rolls a fair die until a six appears on top. What is the probability that it will take Lynn more than two rolls to get a six the first time? A) B) C) D) E)
8.3 and 8.4 Confidence Interval and Inference Test for a Difference Between Two Independent Proportions Same as one proportion, except slightly different formulas and one more condition. Confidence interval for a population difference in proportions confidence interval = statistic + (critical value) (std. dev. for statistic)
Conditions and calculator steps to finding C.I. A recent study of 1000 randomly chosen residents in each of two randomly selected states indicated that the percent of people living in those states who were born in foreign countries was 6.5% for State A and 1.7% for State B. Find a 99% confidence interval for the difference between the proportions of foreign born residents for these two states. Check conditions first. 1) 2) 3) 4) Extra condition: Plausible Independence Condition – It is important to be certain the sample groups are Independent of each other. On Calculator: STAT -> TESTS -> 2 PropZInt.
Finding a Confidence Interval A recent study of 1000 randomly chosen residents in each of two randomly selected states indicated that the percent of people living in those states who were born in foreign countries was 6.5% for State A and 1.7% for State B. Find a 99% confidence interval for the difference between the proportions of foreign born residents for these two states.
Significance Test for a Two-sample difference between two proportions Seatbelt was recorded at 161 locations in Masachusettes, using a random-sampling methods by the National Highway Traffic Safety Administration. Of 4208 male drivers with female passengers , 2777 (66.0%) were belted. But among 2763 male drivers with male passengers only, 1363 (49.3%) wore seatbelts. Complete a significance test to determine if there is a difference in proportions between male drivers who wear seatbelts when sitting with male passenger and the proportion who wear seatbelts when sitting next to female passenger?
Finish the significance Test Independence Randomization Population Sizes Success/Failure Because the conditions are satisfied, I’ll use a Normal model and perform a two-proportion z-test.
Step 2, Step 3, Step 4 Step 2 : State the hypotheses. Ho: There is no difference between the proportion of males wearing seatbelts with female passengers and the proportion of males wearing seatbelts with male passengers. HA: There is a difference between the proportion of males wearing seatbelts with female passengers and the proportion of males wearing seatbelts with male passengers. Step 3 : STAT-> TESTS - > 2-PropZTest Write z-score (test statistic), p-value, make a picture Step 4: Write a conclusion. 8.3 E#50 (a. to c.) complete all steps 8.4 E #73 complete all steps
Show work for z-score Draw curve with S.D.
Conclusion Based on a z-score of 13.38, it is highly unlikely (P value = 0), to get a difference of two proportions at 16.7% or greater if the two proportions were truly the same. I reject the null hypothesis. It appears that the percentage of male drivers that wear seatbelts differs based on whether or not they have male or female passengers.
Next three blocks! • If you haven’t started reviewing, start reviewing for the cumulative test. • Print out either of the outlines on Sharepoint. • Review all your old quizzes, tests, Dr. Tang’s notes, released AP Questions. • Complete 8.3 E#50 (a. to c.) complete all steps 8.4 E #73 complete all steps For H.W. and Read 9.3 and 9.4. Next block after the 9.3 and 9.4 lesson you will complete the multiple choice of the Cumulative test practice. • Remember this is only practice and does not cover Everything you need to know for the cumulative test. • Friday we will review answers to the multiple choice and work on the free response practice in class.