Download
1 / 48
480 likes | 640 Views
Let’s revisit the t -test and add Analysis of Variance. T -Test. Two Sample t-test Comparing two sample means. Signal. It is evident from the formula that the smaller the variability, the larger the t value. Error (Standard error of mean differences). Formulas of variation. Variance:

E N D
T-Test • Two Sample t-test • Comparing two sample means. Signal It is evident from the formula that the smaller the variability, the larger the t value. Error (Standard error of mean differences)
Formulas of variation Variance: Standard Deviation (SD): Standard error of the mean=SEM:
Let’s take an output from a t-test analysis Example from the PASW tutorial
Levene’s test determines if the variance in one group is different from the other. This is an important assumption. The results are significant. Sig. (2-tailed) is the Type 1 error. Confidence intervals
Confidence interval: Definition • In statistics, a confidence interval (CI) is a particular kind of interval estimate of a population parameter and is used to indicate the reliability of an estimate. It is an observed interval (i.e. it is calculated from the observations), in principle different from sample to sample, that frequently includes the parameter of interest, if the experiment is repeated. • http://en.wikipedia.org/wiki/Confidence_interval
Confidence intervals • Confidence intervals can be for a variety of statistics. • Means, t statistics, etc… • For the mean difference as seen in the t-test output, the confidence interval encompasses 95% of all expected t values given the error estimated from our data. • Thus for our example, we expect to obtain a mean difference to be between and include -40.56 and -24.43 95% of the time
CI cont’d • As we can see the value of zero is within that CI. Therefore, we would not reject the null hypothesis. • Indeed, the p value obtained is greater than .05
The value of CI • In most experimental work, investigators simply report the inferential statistic, the p value and, sometimes power. • In many clinical papers, CI is reported, as clinicians feel that the range of possible values is more informative.
CI cont’d • If we know the population values of any distribution we use the Z statistic for the number of SD away from the mean. Thus, the exact values would be +/- 1.96 SD. • When we don’t have the population we use a t statistic for the number of SD away from the mean which varies depending on the sample size (see example in the next few slides).
CI cont’d • Any values within the CI could be considered common values and many physicians would regard those value as normal. However, that would have to be determined against many other measures where a pattern would be obtained.
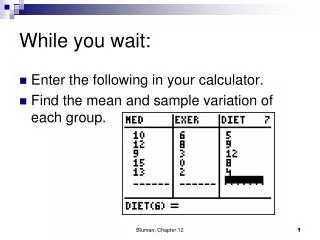
CI example • Scores • 100 • 115 • 125 • 111 • 123 • 198 • Mean=128.67 • SS=6173.3 • Df=6-1=5
CI cont’d • For 5 degrees of freedom the critical t is 2.571 (taken from the t-test tables). • Distance from the mean =14.34±2.571= ±36.88 • CI=128.67±36.88= 91.78 to165.55
Tests of normality • As we discussed before, one of the rules of statistics is that the samples come from normally distributed populations. • We can test whether or not the samples come from normally distributed populations. • The tests are: • Shapiro-Wilk Test for samples less then 50 but can handle greater sample sized. • Kolmogorov-Smirnov Test which is quite suitable for large sample sizes.
Example of output from SPSS We can see here that the data is not normally distributed.
What to do when data is not normal • 1. Transform the data using various formulas suited for the shape of the data. • Square root. • Inverse cubed • Log base 10 • Ln • Etc • 2. Use nonparametric statistics that are insensitive to violations including shape.
Nonparametric tests • Since we have been discussing the t-test we will offer an alternative to it. • There are two: • Mann-Whitney U test • Wilcoxon Sign Rank test • Both provide identical results. The story is that both were independently developed at the same time.
One-Way Analysis of Variance ANOVA aka Single Factor Analysis of Variance 1) when is a one-way analysis of variance used? 2) sources of variation: generally from treatment and from individual differences. 3) an example of a one-way analysis of variance 4) assumptions underlying F-distribution
When would you use a one-way analysis of variance? Example 1: -What if you were interested in investigating the efficacy of 3 types of medication as headache remedies? -You would need to consider… -IV: medication Type: Subjects would be randomly allocated to one of three levels; 1) Tylenol, 2) Bayer, or 3) Advil condition -DV: elapsed time (in minutes) from ingesting the medication to reporting disappearance of headache • 1. Analysis of variance is mostly used with you have more than 2 means. • 2. F = t2 when you have only two groups.
Example 2: -What if we wanted to know whether or not the household income of adults was different depending on political affiliation? -in this case we have 5 groups, representing the political parties. They are: Liberal, NDP, PC, Reform, Bloc Note: This was before the PC and Reform and Canadian Alliance merged. IV (grouping variable): preferred party with 5 levels DV (that variable whose values will be influences by the IV) which is household income
Conceptual basis of analysis of variance ***We want to explain why people differ from each other -is it because of your treatment variable (independent variable)? -or is it just random variation (error)? i.e., want to track down the sources of variation e.g., let's investigate how often UWO students go home during 1 semester Here is random a sample of 12 students and the number of times they go home in a semester. 8, 4, 6, 1, 7, 5, 2, 7, 4, 3, 7, 4
Now we allocate subjects to the distance they have to travel if they which to visit the homestead: < 2 hours drive: 8, 7, 7, 5 2 to 4 hours drive: 6, 7, 4, 4 > 4 hours drive: 3, 1, 2, 4 From the one-way analysis of variance we will be able to identify two sources of variance: 1) distance from home to UWO (treatment or categorization) 2) residual variation that could be due to lots of things (this is the variation that cannot be explained by your IV) or error
This is exactly what happens in an Analysis of Variance • variation is broken down into 2 components: 1. variation due to differences between groups 2. variation due to differences within groups • the analysis measures whether the between groups variance is larger than would be expected by chance by comparing it to the variance within groups
Lets expand on a previous example: Data copied from an excel worksheet representing dollars in thousands. Is the variation between means larger compared to individual differences?
Do you remember the formula for variance? = sample variance The analysis of variance (F test) essentially uses the same conceptual format. Between group (treatment) variance (J=number of groups) Within group (individual subject) variance (N=total sample size) Remember that the F test (ratio) is a statistic used to compare the size of the variance from one source against another. For us, it is comparing between group variance against individual subject variance.
Assumptions associated withthe F distribution 1. Observations come from normally distributed populations. 2. Observations represent random samples from populations. 3. Population variances are equal. 4. Numerator and denominator of F ratio are independent. would be dependent if a score or subject in 1 condition is contingent on having some score or subject in another condition e.g., scores are dependent when a subject in 1 condition scoring high means that a subject in another condition must score low
How would you construct an F-distribution • Determine the number of levels and the number of subjects per level. • From a sample distribution, randomly sample with replacement. • With each sampling calculate the F statistic. • Plot as many calculated Fs possible to obtain a sampling distribution of Fs. • We can now determine beyond which point an F will be observed less than 5% of time if sampling from the same population. • This is called the critical F. • The critical F changes depending on the number levels and the number of subjects per level.
F-Distribution Determination of an F critical from a probability density function. The F critical depends on the number of levels and the number of subjects used in each sample.
One-way analysis of varianceExample Problem A researcher was interested in whether or not various cholesterol reducing drugs called statins actually resulted in a decrease of blood serum Low Density Lipids (LDL). The mechanism by which these drugs work is by inhibiting “HMG CoA reductase” a rate controlling enzyme for the production of cholesterol. Male subjects with higher than recommended cholesterol levels (>160 mg/dL) were randomly assigned to one of four drug levels of the IV called “LDL Reducing Drugs”. The DV is the LDL amount in blood in mg/dL. 1. Atorvastatin 2. Fluvastatin 3. Simvastatin 4. Regular treatment not consisting of a statin. Three weeks after being prescribed the compound, all subjects were asked to visit the research clinic and have their LDL levels measured.
Hypotheses µ refers to mean of the population H0: µA = µF = µS= µR(null) H1: not all means are equal (alternate) Note: You may have noticed that the alternate hypothesis simply states that not all means are equal. The analysis that we will conduct here simply determines if there are means which are not equal (this is an omnibus test). The analysis will not specify which means are different from one another. Following the ANOVA you will have to conduct posthoc analyses which will study later in the lecture.
Statin LDL1 1101 1031 901 941 1012 1202 1152 1132 1052 1143 1003 1013 1103 1063 1044 1504 1444 1294 1334 130 The data IV in column 1: 1=Atorvastatin 2=Fluvastatin 3=Simvastatin 4=Regular treatment. DV in column 2: Measurements in mg/dL.
Results Fα=.05(3,16)=3.24 Since the obtained value is larger compared to the critical value, we can reject the null hypothesis that all samples come from the same population. Hence, a significant treatment effect is observed and we can make a statement that statins have an effect. See tables in the next two slides for the critical values.
DF for Treatment DF for error How to use tables: http://www.statsoft.com/textbook/distribution-tables/
Results from SPSS Treatment Error SPSS results match our hand calculations.
Testing the assumptions 1) Normal distribution: Use Shapiro-Wilk’s test of normality 2) Random sampling: make sure that you sample randomly, but we will have to take your word for it. • Equal variances: tests of homogeneity of variances can be used (e.g., Levene's test). 4) Numerator and denominator are independent: if samples are random, can assume that this is true.
Failures to meet the assumptions 1) F distribution is not terribly affected by small departures. Can transform data if you expect a large departure from normality. 2) Not randomly sampling the population can be probematic. This can be the case if you hand pick samples. Conclusions don’t generalize to population. 3) Can be a problem if variances are extremely different or if sample sizes are unequal. Can transform data or use a nonparametric test. 4) Don't have subjects' scores be dependent on one another.
Comparing Groups • The analysis of variance does not determine specific group differences. • We could use the t-test but we would end up with an unacceptable family wise error (FW). • FW is the accumulation of Type1 errors committed with every comparison. • Three comparisons using the t-test would mean we have FW of 0.15, meaning that we have 15% that at least one comparison shows significant differences between the mean due to chance alone. • We can correct this with a Bonferroni correction • BC=per comparison alpha (PCa) /number of comparisons. • This value becomes the new PCa.
Comparing Groups Cont’d • The Bonferroni correction is somewhat conservative. • Type2 errors are possible. • It is recommended to use Tukey’s Honestly Significant Difference test (HSD). • This test is considered to be a good compromise between Type1 and Type2 errors.
Tukey's HSD(Honestly Significant Difference) 1) used to test for a significant difference between each pair of means 2) a post-hoc test i.e., you didn't plan to do that specific test ahead of time you're reacting to a significant result after you found it controls for Type I error rate () across a bunch of tests (called family-wise ) 3) only used if: (a) The ANOVA is significant. (b) The main effect has more then two groups.
calculate q, where:n = # of subjects/groupMSerror = within groups mean square from Anova table
Our Statin example. • qcritical=4.05, when you have 4 groups and 16 dfs for error. • MSerror from the original analysis=48.375 • N=5 • Let’s compare the Atorvastatin to the control group. • Thus, 99.6 to 137.2. Notice that I’m not concerned about direction. It’s the magnitude that matters here. Thus, these two groups are significantly different from one another.
Post Hoc Tests Shown here are examples of the Tukey and the Bonferroni tests using data from our fictitious study.
Homogeneous Subsets This simply shows aggregates or subsets of groups that are not different from one another.