Download
1 / 34
340 likes | 579 Views
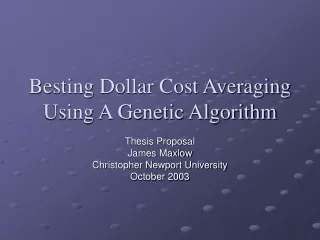
Besting Dollar Cost Averaging Using A Genetic Algorithm. Master’s Degree Thesis James Maxlow Christopher Newport University November 2003. Introduction. Wealth creating through investment is an important goal for fiscally responsible citizens

E N D
Besting Dollar Cost Averaging Using A Genetic Algorithm Master’s Degree Thesis James Maxlow Christopher Newport University November 2003
Introduction • Wealth creating through investment is an important goal for fiscally responsible citizens • Many investors, though, fear or don’t understand the workings of investment markets, and are distrustful of advice given by professionals • Because of this, they may choose to rely on a purely mechanical investing approach known as dollar-cost-averaging that absolves then from falling prey to “bad” investment advice • However, what if there were a mechanical strategy that could outperform DCA?
Purpose • The purpose of this project was to devise mechanical investment strategies that outperform dollar-cost-averaging • If this could be accomplished, then such strategies could be made available to investors as alternatives to DCA • These strategies were based solely on the price histories of investments and associated fees, ignoring any attempts to “time” the market – no prediction of future prices or price changes was made • The devising of strategies was left to the workings of a genetic algorithm
Questions • Some questions that this project will sought to answer are as follows • Does applying the derived strategies to test data sets lead to greater portfolio values than dollar-cost averaging over the same data? • If so, can this result be accepted as a highly probable outcome over any general stock data set? • Given that the program will generate multiple genomes for each input data set, what can be said about the probability of any single strategy producing positive results when used on the test data set?
Questions • Can the results be reliably reproduced, or will wild variations in return on investment values negate any practical use for the program? • Will transaction fees and interest on cash positions provide an advantage to the derived strategy performance?
Research - DCA • The use of DCA allows for the acquisition of shares at a lower average cost than the average share price • Because DCA is an automatic-buy strategy, there are no decisions to be made by the investor, save for the investment itself – it is a hands-off strategy • This makes it appealing to those that feel they have no ability to know when to buy or sell • It is often used by those on fixed incomes and in retirement plans (401k, et. al.) • But does it actually provide good ROI?
Research - DCA • Some research [4] suggests that the use of DCA yields no significantly better ROI than random buy/sell decisions for a given investment • If this is true, then the psychological security that DCA provides hesitant investors may simply hide its relative ineffectiveness • A strategy that bests DCA’s ROI for a given investment, then, would serve as a more productive alternative to random, “time the market” buy/sell decisions
Background – Genetic Algorithms • The majority of today’s GA research expands on the pioneering work done by John Holland in the 60s • GAs work by evolving solutions to problems • More specifically, possible solutions are split, recombined and mutated to breed new solutions that are “more fit” or stronger than their predecessors • As the generations of solutions pass by, the meta-search for the best or ideal solution is focused on promising lineages – most weaker branches are eventually abandoned
Background – Genetic Algorithms • Because of this, the initial time of the GA is spent weeding out totally unfit solutions, and the latter time is spent optimizing very fit solutions • This process can, in many cases, yield greater efficiency in finding an ideal solution than brute-force search techniques • Moreover, a GA only needs to know what a solution will look like – it does not need to have a collection of all possible solutions like a brute-force technique – because it can “create” solutions on its own
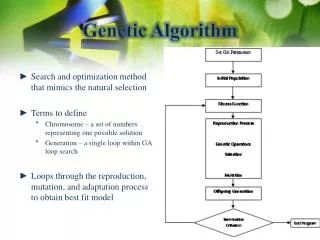
Background – Genetic Algorithms • All of these factors make GAs highly appealing for ill-defined problems that feature odd or unknown solution spaces • Three tasks must be completed to run a GA • First, the structure of the possible solution (chromosome) must be designed • Second, the fitness algorithm for evaluating the strength of possible solutions must be designed • Third, solution population, mating, and mutation variables must be set
Genetic Algorithm Design • The chromosome for this project consisted of an array of 20 integer values between 0 and 2 inclusive • The value corresponded to a buy, sell, or hold decision • The position of the value in the array corresponded to an interval representing a given percentage increase or decrease in stock price [-5%, 0%) [0%, 5%) [5%, 10%) [10%, 15%) [15%, 20%) [25%, 30%) [-20%, -15%) [-15%, -10%) [-10%, -5%) 0 1 1 2 0 0 1 2 2 … …
Genetic Algorithm Design • Any possible solution offered direct advice as to what action to take when a given stock changes in price • But how could the fitness of this advice be judged? • The GA applied the advice of every possible solution it generated to the established sequential price history of a stock – the higher the final ROI for that advice, the stronger the solution [-5%, 0%) [0%, 5%) [5%, 10%) [10%, 15%) [15%, 20%) [25%, 30%) [-20%, -15%) [-15%, -10%) [-10%, -5%) 0 1 1 2 0 0 1 2 2 … …
Genetic Algorithm Design • At this point it can be seen that the GA tried to form advice based on past stock prices – but that in itself does nothing for the investor • It was hoped that there is a hidden structure to stock price fluctuations such that “what worked well in the past will likely work well again in the future” • That is to say that if buying when a stock’s price rose 12% in the past produced positive results, so should repeating that action in the future, in most cases
Genetic Algorithm Design • The next phase, then, was to apply the strongest solutions to a new data set – the “current” stock price values over 3 years – and see how the solution’s ROI compared with DCA over the same time period • If the solution’s ROI was higher, then it will have been established that GA generated advice based solely on price histories can be a better alternative to DCA • If, however, applying the solutions to new data sets failed to produce significantly better results than DCA, then it will have been established that price histories alone are insufficient on which to base decisions
Methodology • Stocks were chosen and price histories acquired • The Dow 30 was cut down to 15 sample stocks based on available data, adjusted prices, and correlation values • Chromosome was implemented in code • Fitness algorithm was implemented in code • Program structure was finalized to allow for robust input and output • Testing was done with various GA parameters to find a good performance compromise
Methodology • For each sample stock and fee/interest variable, the GA was set to work devising 20 strategies from the stock’s price history • Each of these strategies was then be applied to its relevant test data set to determine ROI • 15 stocks, 2 fees, 2 interest rates = 60 program runs resulting in 1200 strategies • DCA’s ROI for each stock was calculated on the test data sets (accounting for fees and interest rates)
Methodology • The results of the devised strategies were statistically analyzed to determine if they indeed offer any benefit over DCA, and if the GA can devise consistently better strategies • This analysis covered mean ROI, minimum ROI, standard deviations, mean/DCA ROI differential, standard deviation “distance” to DCA ROI, and fee and interest rate effects
Price history Calculate share price percentage change history Write to file Calculate dollar cost averaging results Write to file Run genetic algorithm - produce winning genome Apply winning genome to test data set Program Operation x 20
A Note on GA Parameters • Tweaking of GA parameters was performed to increase the mean ROI of the genomes and increase the speed of run completion • Pop: 50 Mut: 0.002 Cross: 0.6 Gen: 5000 • Crossover type: single point (no apparent benefit otherwise; the others slowed the program) • Populations: “Deme” wherein populations are evolved in parallel, joined at certain points, then segregated again – good for diversity
A Note on GA Parameters • Selection method: rank selection was chosen wherein the top n genomes are allowed to mate • Every other selection method I tested failed to produce higher mean ROI values • Speed: an evolution-terminating condition was set to reduce the time spent on the GA • This conditioned checked to see if the ratio of the current – 200th highest genome fitness score to the current highest genome fitness score was 0.999 or higher
A Note on Fees and Interest • Fixed-rate transaction fees were set at 1.5% and 3% • These represented discount and full-service brokerage fees, respectively • Interest rates on cash positions were set at 0% and 2% • The 2% value is somewhat arbitrary since there is no universal savings account or money market interest rate • Each stock was run through the program 4 times to account for the permutations of these values
Results – Mean and Minimum ROI • 55 of 60 program runs produced genomes whose mean ROI over the test data set was higher than the DCA ROI over the same data set • Of the 5 failed runs, 1 mean was lower by approx. 1%; 4 means were significantly lower (all from PG runs) • 46 of 60 runs produced no genome whose ROI was lower than DCA ROI • 1028 out of 1200 total genomes (86%) had ROI higher than DCA • PG contributed 80 of the 172 failing genomes – excluding PG would yield a 92% success rate
Results – Standard Deviations • The mean ROI/DCA ROI differential standard deviation multiple can give insight into the probability that any random genome generated could best DCA 2.25 std dev multiple yields better than a 95% confidence interval Differential 1 std dev 1 std dev DCA ROI Mean ROI
Results – Standard Deviations • 3 stocks had 3+ multiples (99+% confidence int.) • 5 stocks had 2-3 multiples (95+% confidence int.) • 1 stock had 1.53-2 multiples (80+% confidence int.) • 3 stocks had an average multiple of 0.86-1.27 • CAT established a good multiple on 1 of 4 runs • Overall: 15 of 60 runs were at 99+%, 32 of 60 were at 95+%, 41 of 60 were at 68+% • EK, UTX, CAT and C had acceptable but not great results • PG failed completely
Results – Fees and Interest Rates • 1.5% fee runs produced a mean ROI that was 0.55% higher than the 3% fee runs • 13 of the 30 paired runs were higher by 1% or more, yet 11 of the 30 paired runs actually yielded a lower ROI with the 1.5% fee • This can be explained by noting that many of these 11 cases had a relatively high number of hold actions advised in the 3% runs, which incur no fee
Results – Fees and Interest Rates • 2% interest runs produced a mean ROI that was 1.25% higher than the 0% interest runs • 8 of the 30 paired runs were higher by 2% or more • Only 4 of the 30 paired runs actually yielded a lower ROI with the 2% fee • This can be explained by noting that most of these 4 cases had a relatively high number of buy actions advised in the 2% runs, which would reduce the benefit associated with interest on a large cash position – perhaps enough to push the results into the insignificant benefit category
Results – The Loser (PG) • The question remains: Why does the GA perform so poorly when applied to PG’s data? • The mean ROI values of the PG runs were 10-15% below the DCA ROI values • The maximum genome ROI values were 3-9% below the DCA ROI values • The minimum genome ROI values were 15-19% below the DCA ROI values • In short, every genome of every run of PG was a complete failure
Results – The Loser (PG) • Note that for any descending price trend, repeated buying will lead to negative ROI; any combination of buy, sell, and hold would perform better (though not necessarily yielding a positive ROI) • Yet for any ascending price trend, repeated buying will maximize ROI; any combination of buy, sell, and hold cannot keep pace • To see how this might apply to PG, we examine the PG test data set price graph
Results – The Loser (PG) • Here we see a short descent, and then a long sustained upward trend (after one spike) • The GA’s repeated buy, sell, and hold techniques cannot beat DCA in this specific case! • Testing shows that the genomes can beat DCA on the downward slope (-8% vs. -25%) but they lost on the much longer upward slope (-6% vs. 11%)
Results – The Loser (PG) • It is this downward slope followed by a long upward slope that causes the genomes to fail – any stock that exhibits this behavior shows the program’s weakness • In contrast, the two best performers (GM and DIS) showed high variability in prices, despite slight overall downward trends
Conclusion • The genomes of investment advice generated by the program have no difficulty in besting DCA ROI results in the vast majority of cases • The singular failure of the genome advice is revealed when it is applied to any sustained, low variability upward price trend – for nothing can top repeated buying on such a trend • This effect is compounded when preceded by a sustained low variability downward trend
Conclusion • Failure on such trends can be mitigated, however • If the investor monitors the performance of the stock to which he or she is applying the genome advice, the beginnings of any sustained upward trend can be noted – at which point the investor can abandon the genome advice, switching to repeated buying, until the trend appears to falter (vary significantly) • The genome advice, which thrives on variability, can then be enacted again
Conclusion • The ability to notice situations in which the genomes would produce weak ROI, combined with their great performance on all other tested situations, leads me to conclude that this project was a success • These genomes can best DCA in the majority of cases, and further refinement of the algorithm may lead to even greater success
References • [1] Edleson, M. E. Value Averaging: The Safe and Easy Investment Strategy. Chicago: International Publishing Corporation, 1991. • [2] GAlib documentation: http://lancet.mit.edu/ga/ • [3] Liscio, J. Portfolio Discipline: The Rewards of Dollar Cost Averaging. Barron’s, Aug. 8, 1988, pp. 57-58. • [4] Marshall, Paul S. A Statistical Comparison of Value Averaging vs. Dollar Cost Averaging and Random Investing Techniques. Journal of Financial and Strategic Decisions: Vol. 13 No. 1, Spring 2000. • [5] Mitchell, Melanie. An Introduction to Genetic Algorithms. Cambridge: The MIT Press, 2002. • [6] The Vanguard Group of Investment Companies. The Dollar Cost Averaging Advantage. Valley Forge: Brochure #0888-5, BDCA, 1988.