Download
1 / 20
200 likes | 505 Views
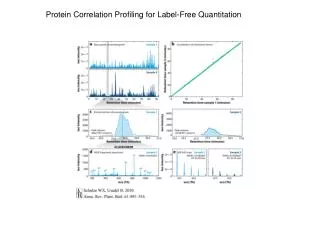
Protein Correlation Profiling for Label-Free Quantitation. Proteome Coverage for Quantitation. Only a subset of the proteome is identified, and of that, only the higher abundance proteins can be quantitated!. Arabidopsis Seedlings: LL + Sucrose , 7 days DD - Sucrose, 1 day

E N D
Proteome Coverage for Quantitation Only a subset of the proteome is identified, and of that, only the higher abundance proteins can be quantitated!
Arabidopsis Seedlings: LL + Sucrose , 7 days DD - Sucrose, 1 day Resupply 30 mM Suc in the dark: 0 to 30 min Plasma Membranes isolated Phosphpeptides enriched (IMAC) LC/MS/MS and MS3 (label free quantitation)
Sucrose Supply Increases Phosphorylation of Thr-947 Activating Proton Pumping
Novel Regulation of the H+-ATPase by C-terminal Phosphorylation Phospho Thr-881 activates in the absence of a 14-3-3 protein 850 860 870 880 890 900 IRYILSGKAW ASLFDNRTAF TTKKDYGIGE REAQWAQAQR TLHGLQPKED VNIFPEKGSY 910 920 930 940 RELSEIAEQA KRRAEIARLR ELHTLKGHVE SVAKLKGLDI DTAGHHYTV Phospho Thr-948 activates but only in the presence of a 14-3-3 protein
Clustering of time responses of the quantified phosphorylation sites by increase in sum of squares (Ward's method) reveals four significant response clusters as determined by greatest deviation from clusters in randomized datasets.Graphs show the mean response curve of all members of that cluster. Niittylä T et al. Mol Cell Proteomics 2007;6:1711-1726 ©2007 by American Society for Biochemistry and Molecular Biology
Protein:Protein Interactions Genome Proteome Interactome PTMs Posttranslational Modifications—II
Interaction network of disease-associated proteins. All interactions
A Predicted Interactome for Arabidopsis Jane Geisler-Lee, Nicholas O'Toole2, Ron Ammar2, Nicholas J. Provart, A. Harvey Millar and Matt Geisler* Figure 2. Visualizing the Arabidopsis predicted interactome. A, Giant hairy ball of all 19,979 interactions visualized by Cytoscape. B, Enlargement showing example of some detail captured by visualization. C, Different types of protein nodes classified as major hubs when interacting with 50 to 100 other proteins, medium hubs 11 to 50, minor hub three to five, pipes two, free end one, and unconnected zero interacting proteins. D, Frequency distribution of different node classes based on number of interacting partners.
A membrane protein/signaling protein interaction network for Arabidopsis version AMPv2 Sylvie Lalonde1*, X(22) and Wolf B. Frommer1 Frontiers in Plant Physiology
Receptor-Like Kinase Interactions Ammonium Transporter Figure 8. Ammonium transporter sub-network.(A) AMT1;1 sub-network (AT4G13510). Labeling as in Figure 5. (B) Independent analysis of AMT1;1 interaction with two RLKs identified in AMPv2 using the split luciferase assay in Arabidopsis leaf protoplasts. Red asterisks in the diagram to the right indicate the position of the split luciferase fusions. Figure 5. Sub-network of receptor kinase interactions (RLK). Labeling as in Figure 3. The blue borders surrounding 31 individual RLKs indicate evidence for phosphorylated sites according to PhosPhAt 3.0 (Durek et al., 2010).
Some Protein Interaction Domains Dr. Tony Pawson Mount Sinai Hospital The figure shows the SH2 domain of v-src bound to a pYEEI peptide ligand. Phosphotyrosine binding (PTB) domains are 100-150 residue modules that commonly bind Asn-Pro-X-Tyr motifs. The figure presents the first FHA domain of Rad53 in complex with a phosphothreonine containing peptide. In this structure, the primary contact on the peptide occurs at the phosphothreonine and the +4 aspartic acid residue.
Phospholipid binding: pS/pT binding: Pro-rich binding: “general” pY binding:
Various approaches to study at the 'proteomic level' (Far-Western overlay; immobilized 1433 columns). 14-3-3s are highly conserved pSer/pThr-binding proteins (Sehnke, DeLille and Ferl. Plant Cell, Supplement 2002: S339-S354)
Molecular ‘Anvil’ mechanism for 1433s 14-3-3 Modes of Action: illustrative examples (Tzivion et al. JBC 277 (2002) 3061-3064)