Download
1 / 56
580 likes | 721 Views
GIS Overview. What is GIS?. GIS (Geographic Information System): computer information system that can input, store, manipulate, analyze , and display geographically referenced (spatial) data to support decision making processes. . Tools for a GIS. Hardware Computer Printer / Plotter

E N D
What is GIS? GIS (Geographic Information System): computer information system that can input, store, manipulate, analyze, and display geographically referenced (spatial) data to support decision making processes.
Tools for a GIS • Hardware • Computer • Printer / Plotter • Digitizer • Scanner • GIS Desktop Software (ESRI, Inc. – ArcView) • CAD Software (AutoDesk - AutoCAD) • Multimedia (Photos, Video, 3D Models) • World Wide Web (ESRI, Inc. – ARCIMS) • Personnel
GIS Data Sources • Digitized and Scanned Maps • purchased, donated, free (Internet) • created by user • Data Bases– Tables of data • GPS– Global Positioning System • accurate locations • Field Sampling of Attributes • Remote Sensing & Aerial Photography
Conventional Information Systems • Answer the following questions: • Who ? • What ? • When ? • Why ? • How ?
GIS answers the following • Location:What is at...? • Condition:Where is it? • Trends:What has changed since...? • Patterns:What spatial patterns exist? • Modeling:What if…? Exploring data using GIS turns data into information into knowledge
Data Data Data • Location DataHow Many? – What Kind? – Where? • Scale of DataGlobal to Local • Data Presentation Words, Charts, Graphs, Tables, Maps, Photos
Databases • Not easy to interpret
Visualizing Data A picture is worth a thousand words
GIS Data • Raster Images - grids • “pixels” • a location and value • satellite images and aerial photos • Vector - grids • Features: points, lines & polygons • Attributes: size, type, length, etc.
“Layers” of GIS Information Municipalities
“Layers” of GIS Information Census Tracts
“Layers” of GIS Information Lakes and Rivers
“Layers” of GIS Information Polluting Companies
“Layers” of GIS Information Schools
GIS Turns Data into Information A picture is worth a thousand words
Conclusions • State level analysis results indicated Transylvania County as the high risk area in terms of number of children per each HSDS, • County level analysis results indicated Brevard Township as the high risk area in terms of combined effect of young population density and HSDS density, • Township level analysis results indicated • 4 different HSDS located at the southern region of Brevard Township as potential risk-producing areas, • 2 public schools within 10 minute walking distance buffer of previously detected HSDS, • 4 public water supply sources (PWSS) two of which may supply water to public schools and daycare centers, • A total of 2,593 people living within 10 minute walking distance of specified HSDS, and total of 506 people (between the ages of 0 and 17) within the same distance.
Obesity Research Objectives • To evaluate if the degree of pediatric obesity, assessed by BMI Z scores, is related to proximity to fast food restaurants or distance from parks. • To determine if the effectiveness of treatment of obesity is related to the following: age, gender, race/ethnicity, number of follow up visits, and proximity to the treatment center. • Design/Methods • Patient addresses (n=1,014) were mapped with GIS, and then overlaid with parks, fast food locations, and additional layers including socioeconomic, political, school, and neighborhood districts. • Distance buffers from the WMWC were created and overlaid with patient addresses and BMI Z score changes following treatment.
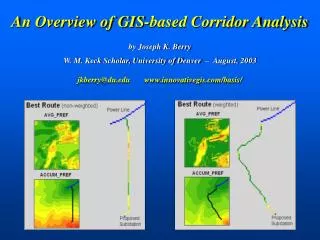
Travel Distances : Z Score Change (-.5 to -2.16), Total 38 Results Proximity to the center was unrelated to success in BMI decreases Travel Distances: Z Score Change (.5 to 2.81) Total 8
Results • Of patients with moderate BMI decrease (Z score change > -0.5), 43.7% live within 600 feet of a park and 56.3% farther than • 1200 feet. Mean distance to fast food is 1.1 miles. • Of patients with moderate BMI increases (Z score change > 0.5), 16.7% live within 600 feet of a park and 83.3% farther than 1200 feet. Mean distance from fast food is .8 miles. Patient Locations Compared to Fast Food and Parks
Property Value and Street Trees An Analysis of the City of Pittsburgh Neighborhoods, 2009
City of Pittsburgh NeighborhoodsResidential Sales, 2009 Average Sale Price by Neighborhood Note: white areas indicate no sales Source: Allegheny County
City of Pittsburgh Neighborhoods and Street Trees, 2009 Number of Trees per Neighborhood Source: Friends of the Pittsburgh Urban Forest
A “High Risk” Poverty Index Geospatial Analysis Methods for the Greater Pittsburgh Community Food Bank Heinz College: School of Public Policy & Management Brandon C. Loughery, MAM Kristen Kurland, Faculty Advisor Larry Hokaj, Chief Technology Officer GPCFM Spring 2009
Introduction There are three project objectives: • Provide background information to use additional geospatial information systems (GIS) technology for evaluation and predictive processes • Gain a more thorough understanding of the communities GPCFB serves. • Create and implement a delimited index to help identify populations that need the Food Bank’s services the most.
Poverty Variables • Householders in renter-occupied housing with income below the poverty level who receive public assistance income • Total number of the youth population 18 years and younger, by block group, who live at or below the poverty line • Total number of elderly population 65 years and older, by block group, who live at or below the poverty line • Total number of families, by block group, who have a female household head (no husband present) with related children under 18 years of age • The number of elderly population 65 years and older with income below the poverty level and a disability • Total number of families who have a female household head (no husband present) where the household head worked full-time, year round in 1999 and lived below the poverty level • The total number of adults over the age of 18 with no high school diploma *The variables are taken directly from the Sample File 3 (SF 3) sample population data from the U.S. Census.
“High Risk” Poverty Areas Contour Line ≥ 9 Low Risk Medium Risk High Risk
GPCFB Program Locations and High Risk Poverty Areas Low Risk Medium Risk High Risk