Download
1 / 2
20 likes | 160 Views
Drought frequency analysis allows to gain awareness of the extent of previous drought events in terms of duration and magnitude and helps predict the riskiest hydrologic situation from the standpoint of water supply.

E N D
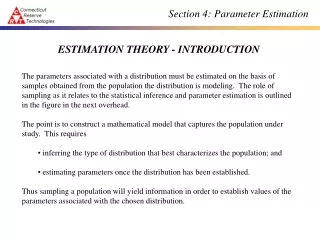
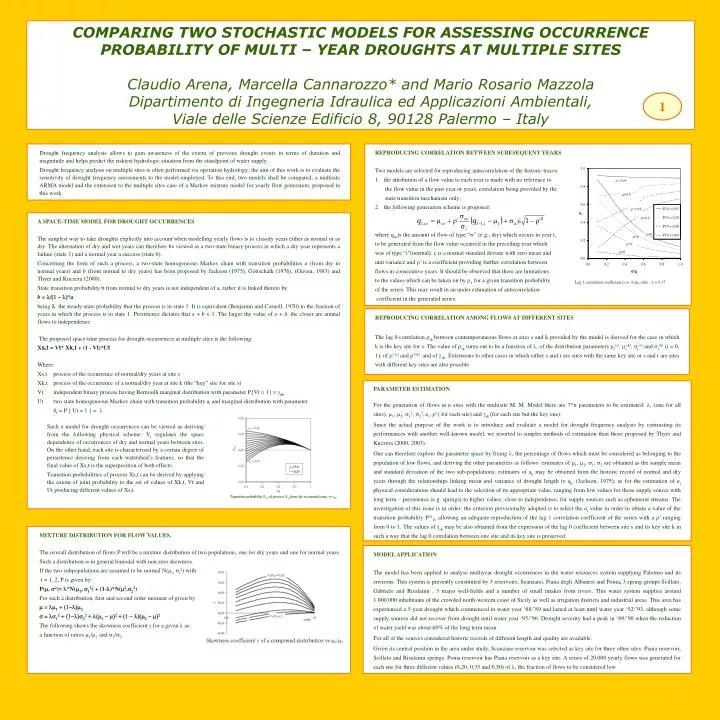
Drought frequency analysis allows to gain awareness of the extent of previous drought events in terms of duration and magnitude and helps predict the riskiest hydrologic situation from the standpoint of water supply. Drought frequency analysis on multiple sites is often performed via operation hydrology; the aim of this work is to evaluate the sensitivity of drought frequency assessments to the model employed. To this end, two models shall be compared, a multisite ARMA model and the extension to the multiple sites case of a Markov mixture model for yearly flow generation, proposed in this work. PARAMETER ESTIMATION For the generation of flows at n sites with the multisite M. M. Model there are 7*n parameters to be estimated: l, (one for all sites), m1, m2, s12, s22,ai, r’( for each site) and gsk (for each site but the key one). Since the actual purpose of the work is to introduce and evaluate a model for drought frequency analysis by contrasting its performances with another well-known model, we resorted to simpler methods of estimation than those proposed by Thyer and Kuczera (2000, 2003). One can therefore explore the parameter space by fixing l, the percentage of flows which must be considered as belonging to the population of low flows, and deriving the other parameters as follows: estimates of m1, m2, s1, s2 are obtained as the sample mean and standard deviation of the two sub-populations; estimates of ak may be obtained from the historic record of normal and dry years through the relationships linking mean and variance of drought length to ak, (Jackson, 1975); as for the estimation of ai physical considerations should lead to the selection of its appropriate value, ranging from low values for those supply source with long term – persistence (e.g. springs) to higher values, close to independence, for supply sources such as ephemeral streams. The investigation of this issue is in order: the criterion provisionally adopted is to select the ai value in order to obtain a value of the transition probability P(i)10 allowing an adequate reproduction of the lag 1 correlation coefficient of the series with a r’ ranging from 0 to 1. The values of gsk may be also obtained from the expression of the lag 0 coefficient between site s and its key site k in such a way that the lag 0 correlation between one site and its key site is preserved. COMPARING TWO STOCHASTIC MODELS FOR ASSESSING OCCURRENCE PROBABILITY OF MULTI – YEAR DROUGHTS AT MULTIPLE SITES Claudio Arena, Marcella Cannarozzo* and Mario Rosario MazzolaDipartimento di Ingegneria Idraulica ed Applicazioni Ambientali,Viale delle Scienze Edificio 8, 90128 Palermo – Italy 1 REPRODUCING CORRELATION BETWEEN SUBESEQUENT YEARS Two models are selected for reproducing autocorrelation of the historic traces: 1. the attribution of a flow value to each year is made with no reference to the flow value in the past year or years, correlation being provided by the state transition mechanism only; 2. the following generation scheme is proposed: where qtwis the amount of flow of type “w” (e.g., dry) which occurs in year t, to be generated from the flow value occurred in the preceding year which was of type “i”(normal). e is a normal standard deviate with zero mean and unit variance and r’ is a coefficient providing further correlation between flows in consecutive years. It should be observed that there are limitations to the values which can be taken on by r1 for a given transition probability of the series. This may result in an under estimation of autocorrelation coefficient in the generated series. A SPACE-TIME MODEL FOR DROUGHT OCCURRENCES The simplest way to take droughts explicitly into account when modelling yearly flows is to classify years either as normal or as dry. The alternation of dry and wet years can therefore be viewed as a two-state binary process in which a dry year represents a failure (state 1) and a normal year a success (state 0). Concerning the form of such a process, a two-state homogeneous Markov chain with transition probabilities a (from dry to normal years) and b (from normal to dry years) has been proposed by Jackson (1975), Gottschalk (1976), (Güven, 1983) and Thyer and Kuczera (2000). State transition probability b from normal to dry years is not independent of a, rather it is linked thereto by b = l/(1 - l)*a being l the steady-state probability that the process is in state 1. It is equivalent (Benjamin and Cornell, 1970) to the fraction of years in which the process is in state 1. Persistence dictates that a + b < 1. The larger the value of a + b, the closer are annual flows to independence The proposed space-time process for drought occurrences at multiple sites is the following: Xs,t = Vt* Xk,t + (1 - Vt)*Ut Where: Xs,t process of the occurrence of normal/dry years at site s Xk,t process of the occurrence of a normal/dry year at site k (the “key” site for site s) Vt independent binary process having Bernoulli marginal distribution with parameter P{Vt = 1} = gsk Ut two state homogeneous Markov chain with transition probability ai and marginal distribution with parameter dt = P { Ut = 1 } = l REPRODUCING CORRELATION AMONG FLOWS AT DIFFERENT SITES The lag 0 correlation rsk between contemporaneous flows at sites s and k provided by the model is derived for the case in which k is the key site for s. The value of rsk turns out to be a function of l, of the distribution parameters mi(s), mi(k), si(s) and si(k) (i = 0, 1), of r’(s) and r’(k) and of gsk. Extensions to other cases in which either s and r are sites with the same key site or s and r are sites with different key sites are also possible Such a model for drought occurrences can be viewed as deriving from the following physical scheme: Vt regulates the space dependence of occurrences of dry and normal years between sites. On the other hand, each site is characterised by a certain degree of persistence deriving from each watershed’s features, so that the final value of Xs,t is the superposition of both effects. Transition probabilities of process Xs,t can be derived by applying the axiom of joint probability to the set of values of Xk,t, Vt and Ut producing different values of Xs,t. MIXTURE DISTRIBUTION FOR FLOW VALUES. The overall distribution of flows P will be a mixture distribution of two populations, one for dry years and one for normal years. Such a distribution is in general bimodal with non zero skewness. If the two subpopulations are assumed to be normal N(mi, si2) with i = 1, 2, P is given by: P(m, s2)= l*N(m1, s12) + (1-l)*N(m2,s22) For such a distribution, first and second order moment of given by m = lm1 + (1-l)m2 s = ls12 + (1-l)s22 + l(m1 - m)2 + (1 - l)(m2 - m)2 The following shows the skewness coefficient g for a given l as a function of ratios m1/m2 and s1/s2. MODEL APPLICATION The model has been applied to analyse multiyear drought occurrences in the water resources system supplying Palermo and its environs. This system is presently constituted by 3 reservoirs, Scanzano, Piana degli Albanesi and Poma, 3 spring-groups Scillato, Gabriele and Risalaimi , 3 major well-fields and a number of small intakes from rivers. This water system supplies around 1.000.000 inhabitants of the crowded north-western coast of Sicily as well as irrigation districts and industrial areas. This area has experienced a 5-year drought which commenced in water year ‘88/’89 and lasted at least until water year ‘92/’93, although some supply sources did not recover from drought until water year ‘95/’96. Drought severity had a peak in ‘89/’90 when the reduction of water yield was about 60% of the long term mean. For all of the sources considered historic records of different length and quality are available. Given its central position in the area under study, Scanzano reservoir was selected as key site for three other sites: Piana reservoir, Scillato and Risalaimi springs. Poma reservoir has Piana reservoir as a key site. A series of 20.000 yearly flows was generated for each site for three different values (0,20, 0,35 and 0,50) of l, the fraction of flows to be considered low.
COMPARING TWO STOCHASTIC MODELS FOR ASSESSING OCCURRENCE PROBABILITY OF MULTI – YEAR DROUGHTS AT MULTIPLE SITES Claudio Arena, Marcella Cannarozzo* and Mario Rosario MazzolaDipartimento di Ingegneria Idraulica ed Applicazioni Ambientali,Viale delle Scienze Edificio 8, 90128 Palermo – Italy 2 MULTISITE ARMA MODEL FOR YEARLY FLOW GENERATION In order to compare the results supplied by the multisite M. M. model and contrast its performances, a multivariate ARMA model has been fitted to the series. Xt = FXt-1 + Vt - QVt-1 in the assumption of diagonality [Salas et al. (1980) and Loucks et al. (1981)] of matrices F and Q, their elements are the parameters of univariate ARMA(1,1) models fitted at each site. Xt is an n×1 vector of normally distributed flow residuals occurring at the n sites at time t and Vt is an n×1 vector of normally distributed random fluctuations with covariance matrix G. Spatial correlation among concurrent flows at different sites is provided by the innovations Vt which are independent in time, but correlated in space, through their covariance matrix. The model fitting process consists of two independent stages: estimation of f1i and q1i, i = 1,....n and estimation of G conditioned on F and Q. An AR(1) model was fitted to the three spring groups after examination of partial autocorrelogram Historic and generated lag 0 coefficients between sites □ observed■Multivariate ARMA ●l = 0.20 ○ l = 0.35 Dl = 0.50 • ANALYSIS OF GENERATED DATA FOR DROUGHT FREQUENCY ASSESSMENT • The 20.000 data generated for each site at year I, are summed to give the overall water yield of the whole system in year i. The analysis of the yearly overall water yield was performed using the procedure described by Frevert et al. (1989), i.e. by dividing the 20.000 yr. series in twenty sub-series of 1.000 years. The number of times in which the overall water yield in a n-yr. sequence is smaller than a given threshold is divided by the number of n-yr. sequences contained in the twenty 1.000 yr. traces to give the non exceedance probability of a given water yield in n years. Data from the multisite M.m.m are those with l = 0,35 • In order to investigate this issue, the return period of critical periods of different length was assessed for each site and for the combination of sites for different values of l as illustrated in the tables. Results confirm that only in some cases is the novel M.m.m. able to provide drought frequencies that are more conservative than its ARMA counterparts both at – site and overall. • It should be observed that • - the marginal distributions of flow appears to be better reproduced by the M.m.m. than by the ARMA model selected; • - when it comes to generating multiyear droughts, the M.m.m. performs less satisfactorily, both at site and overall; • however, results obtained by “external” l values are often comparable to those provided by the ARMA, on the other hand, an intermediate l value (l = 0,35) provides decidedly less satisfying return periods; • the relationship between l and return period does not appear to be monotonic. • In water year ‘89-90, the driest on record, the historical overall water yield was 44,3 Mm3 corresponding to a return periodof • 116 years for the M.m.m. • 303 years for the ARMA • The seven water years from 1988/89 to 1994/95 can be regarded as a single drought phenomenon: for n = 7 and an historical overall water yield of 521 Mm3, one reads in figure a return period of • 233 for the M.m.m. • 103 for the multisite ARMA • This comparison shows that, at least for l = 0,35, the two models can lead to quite different results. • This may be due to a number of causes: • a poor ability of the multisite M.m.m. to reproduce spatial correlation; • an incapability of the model to reproduce marginal droughts tout court; • an inappropriate selection of model parameters. CONCLUSIONS Two stochastic generation techniques of yearly flows have been compared with regard to the quality of multiyear drought frequency assessments at multiple sites they are able to provide. One of such models, the here introduced multisite Markov Mixture model accounts explicitly for the alternation of normal and dry years, whereas the other is the well established multinormal ARMA. Such a novel model is motivated by the fact that the evidence that interactions of global climatic mechanisms with quasi – cyclic characteristic produce alternating wet and dry regimes in hydroclimatic time series has been found in a number of regions and this calls for appropriate models. In the application to drought frequency assessment of the water resources system supplying Palermo (Italy), parameter estimation is partly given up in favour of a research in the parameter space based on different values of l, the fraction of year to be considered low. Under many conditions, the multisite M.m.m. is able to yield return periods of occurrences of dry periods which are more conservative (i.e. shorter) than those supplied by the multisite ARMA model. This holds true for any choice of l for one-year droughts, whereas multiyear droughts tend to be assessed more conservatively by either low or high values of l, with intermediate l values yielding underestimated return periods of droughts. The model introduced hence shows to have a potential to generate yearly flows with the specific aim at reproducing droughts and can be employed in simulation studies of multi-source water systems. REFERENCES Benjamin JR, Cornell CA (1970) Probability, Statistics and Decision for Civil Engineers, McGraw-Hill, New York Box GE, Jenkins G (1976) Time Series Analysis, Forecasting and Control, Holden-Day, Oakland, California Bras RL, Rodriguez Iturbe I (1993) Random Functions and Hydrology, Dover Publications, New York Claps P, Rossi F, Vitale C (1993) Conceptual-stochastic modeling of seasonal runoff using autoregressive moving average models and different scales of aggregation.Water Resources Research 29(8): 2545-2559 Frevert DK, Cowan MS, Lane WL (1989) Use of stochastic hydrology in reservoir operation.Journal of Irrigation and Drainage Engineering ASCE 115(3): 334 - 343 Gottschalk L (1976) Frequency of dry years, Bullettin series A, n. 55, University of Lund - Tenth anniversary, Lund, Sweden Güven O (1983) A simplified semiempirical approach to probabilities of extreme hydrologic droughts.Water Resources Research 19(1): 441-453 Jackson BB (1975) Markov mixture models for drought length. Water Resources Research 16(2): 64-74 Lee KS, Sadeghipour J, Dracup JA (1986) An approach for frequency analysis of multiyear drought durations.Water Resources Research 22(5): 655-662 Loucks DP, Stedinger JR, Haith DA (1981) Water Resources Systems Planning and Analysis, Prentice Halls, Englewood Cliffs, New York Salas JD, Delleur JW, Yevjevich V, Lane WL (1980) Applied Modeling of Hydrologic Time Series, Water Resources Publications, Littleton, Colorado Stedinger JR, Lettenmaier DP, Vogel RM (1985) Multisite ARMA(1,1) and disaggregation models for annual streamflow generation. Water Resources Research 21(4): 497-509 Thyer M, Kuczera G (2000) Modeling long-term persistence in hydroclimatic time series using a hidden state Markov model.Water Resources Research 36(11): 3301 – 3310 Thyer M, Kuczera G (2003) A hidden Markov model for modelling long-term persistence in multi-site rainfall time series 1.Model calibration using a Bayesian approach. Journal of Hydrology 275: 12-26 Thyer M, Kuczera G (2003) A hidden Markov model for modelling long-term persistence in multi-site rainfall time series 2. Real data analysis.Journal of Hydrology 275: 12-26