Download
1 / 13
130 likes | 154 Views
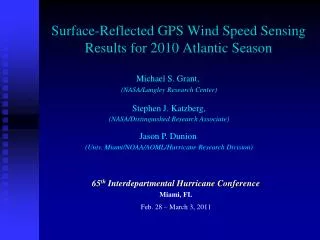
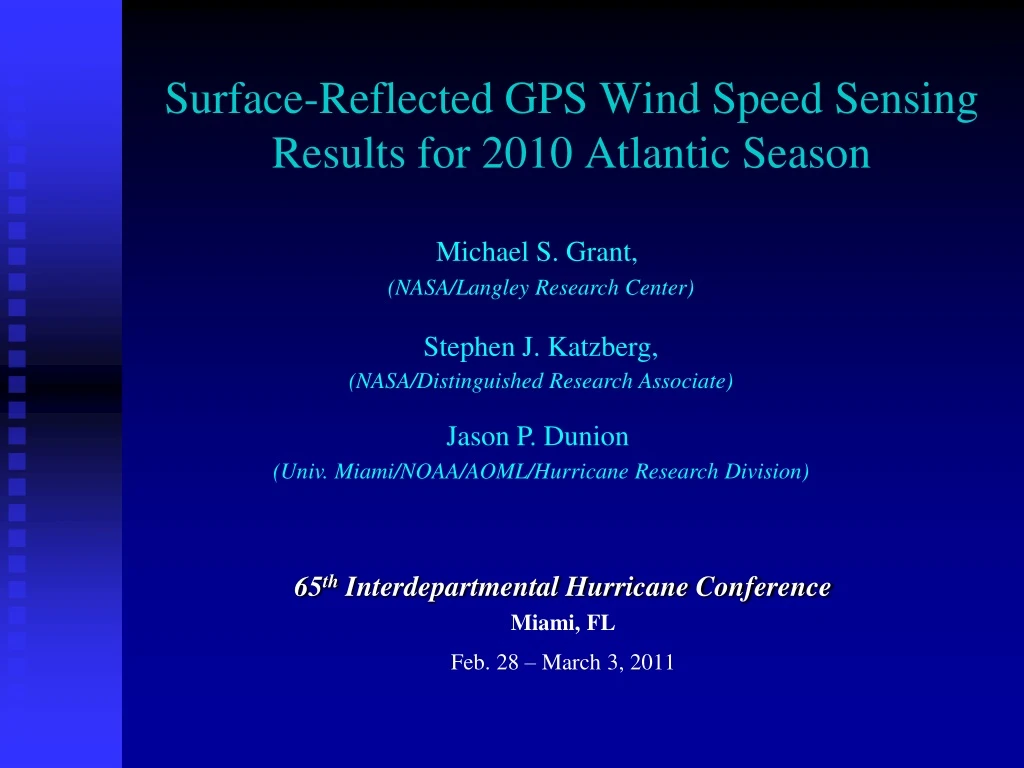
Michael S. Grant, (NASA/Langley Research Center) Stephen J. Katzberg, (NASA/Distinguished Research Associate) Jason P. Dunion (Univ. Miami/NOAA/AOML/Hurricane Research Division). Surface-Reflected GPS Wind Speed Sensing Results for 2010 Atlantic Season.

E N D
Michael S. Grant, (NASA/Langley Research Center) Stephen J. Katzberg, (NASA/Distinguished Research Associate) Jason P. Dunion (Univ. Miami/NOAA/AOML/Hurricane Research Division) Surface-Reflected GPS Wind Speed Sensing Results for 2010 Atlantic Season 65th Interdepartmental Hurricane Conference Miami, FL Feb. 28 – March 3, 2011
Presentation Outline • Surface-Reflected (Bistatic) GPS Method • 2010 Storm Season Wind Speed Retrievals • Retrieval examples • Quantitative comparisons to SFMR and dropsondes • Summary Statistics for Measurement Comparisons • Future Research Objectives
(Instrument Correlation Peak) GPS z Correlation (Reflected Power) h Reflection Area x S delay, τ γ P y Ocean Roughness / Wind Speed from Bistatic Surface Reflections • Reflected GPS signal strength (~ power) vs. delay is measured • Waveform widens (more scattering) with increasing surface roughness. • Sensing location on surface depends on satellite-aircraft reflection path geometry • Ocean ‘roughness’ (surface slope variance) used to infer surface wind speed • Slope-to-wind speed: empirical relationship. Increasing Surface Roughness Constant Path Delay Ellipses in Reflection Area
AOC WP-3D Orion Cessna 206 NASA Bistatic GPS Instrument Accommodation • GPS Instrument easily deployed • Light aircraft and up • Flown (2004) Aerosonde UAV – 10’ wing span Aerosonde UAV • Instrument - Receiver Unit and two Antennae • Instrument size ~ 16 x 12 x 7 inches • Weight < 10 lbs. • 3.5” nadir antenna NASA-Langley Bistatic GPS Instrument
GPS Instrument 2010 Atlantic Storm Season Deployments • NASA-Langley bistatic GPS instruments deployed on ‘N42 and ‘N43 P-3 Hurricane Hunter Aircraft (Aircraft Operations Center, Tampa) • Instruments operated by AOC personnel (Power on, autonomous operation, power off, upload flight data to ftp site post-mission) • 31 total P-3 flights (incl. ferry) where GPS instruments were operated. • Data sets acquired on all flights – no instrument anomalies. • 18 GPS data sets had contemporaneous data available for comparison: • SFMR, Flight-Level winds, and dropsondes (16 of 18) • Variety of SFMR/dropsonde wind speeds ranges for the 18 GPS data sets: • lowest: 2 – 12 ms-1 • highest: 5 – 60+ ms-1 • For 2010 quantitative comparisons, only GPS over-land reflections data removed. • No other data exclusions or masking operations were performed.
Initial calibration using Navy COAMPS model [3] Comparison with dropsondes at hurricane wind speeds [4] Wind Speed Retrieval Intercomparisons - Background • Stepped-Frequency Microwave Radiometer (SFMR) [1] • Operational instrument, high precision (within 2% at 30 ms-1) [2] • Emissivity (brightness temp., TB), surface wind speed proportional to % sea foam. • NASA-Langley Bistatic GPS Instrument - surface wind speed obtained from measured sea-surface slopes through empirical relationship [3][4] [1] Black, P. G., and C. L. Swift, 1984: Airborne stepped frequency microwave radiometer measurements of rainfall rate and surface wind speed in hurricanes. Second Conf. on Radar Meteorology, Zurich, Switzerland, Amer. Meteor. Soc. [2] Uhlhorn, Black, etal., Hurricane Surface Wind Measurements from an Operational Stepped Frequency Microwave Radiometer, Monthly Weather Review, 2007, Vol. 135, p. 3070 [3] Katzberg, Stephen J., Omar Torres, and George Ganoe, “Calibration of reflected GPS for tropical storm wind speed retrievals”; Geophys. Res. Lett., 33, L18602, doi:10.1029/2006GL026825, 2006 [4] Katzberg, S. J., and J. Dunion , “Comparison of reflected GPS wind speed retrievals with dropsondes in tropical cyclones,” Geophys. Res. Lett., 36, L17602, doi:10.1029/2009GL039512., 2009
Histogram of (SFMR – GPS) differences (ms-1) Wind Speed Retrieval Intercomparisons - Quantitative • Low-wind speed example -Tropical Depression #5 (Aug 11, 2010) • Comparison to SFMR • Mean diff. = 4.3 ms-1 (GPS underestimate) • RMS diff. = 2.3 ms-1 • Comparison to dropsondes • Mean diff. = -0.5 ms-1 (GPS overestimate) • RMS diff. = 2.9 ms-1
Wind Speed Retrieval Intercomparisons – Quantitative, cont’d • High-wind speed example 1 – Hurricane Earl (Sept 1, 2010) Histogram of (SFMR – GPS) differences (ms-1) • Comparison to SFMR • Mean diff. = -0.4 ms-1 • RMS diff. = 7.2 ms-1 • 12 - 20 ms-1 difference at eyewall • Comparison to dropsondes • Mean diff. = 2.7 ms-1 (HSA-file, single near-surface value)
Histogram of (SFMR – GPS) differences (ms-1) Wind Speed Retrieval Intercomparisons – Quantitative, cont’d • High-wind speed example 2 – Hurricane Earl along East Coast (Sept 3, 2010) • Comparison to SFMR • Mean diff. = 5.9 ms-1 • RMS diff. = 7.2 ms-1 • Comparison to dropsondes • Mean diff. = 4.2 ms-1 (GPS underestimate) • RMS diff. = 7.2 ms-1
Wind Speed Retrieval Intercomparisons – Summary Statistics Primarily due to hurricane eyewall. • Higher variability and larger range in true wind speed. • GPS measurement differences with dropsondes and SFMR generally increased with storm maximum wind speed. • GPS wspd. absolute mean differences: • 0.3 – 7.5 ms-1 (SFMR) • 0.1 – 16.3 ms-1 (drops.) • GPS wspd. RMS differences: • 2.3 – 11.8 ms-1 (SFMR) • 0.4 – 8.9 ms-1 (drops.)
Aggregate GPS Measurement Performance per Max Wind Speed Category (all entries in ms-1) Category Differences: Mean ± 1σ† Max Wspd (vs. SFMR) (vs. Dropsondes) 12 - 20 0.6 ± 3.6 1.5 ± 4.0 28 - 35 3.7 ± 9.3 2.7 ± 7.9 40 - 62 7.8 ± 8.9 0.4 ± 11.8 †σ is the largest RMS diff. in each category Wind Speed Retrieval Intercomparisons – Summary Statistics, cont’d • The 18 retrievals (data sets) were categorized in 3 maximum wind speed ranges ( 6 sets per category )
Summary, Future Objectives • NASA Bistatic GPS instruments on NOAA ‘N42 and ‘N43 a/crft performed well • No anomalies, equivalent retrieval quality from each instr. • GPS-derived surface wind speed generally compared well to SFMR and dropsonde measurements. • Best performance (vs. dropsondes) currently over the 0 – 35 ms-1 range: • bias (underestimate) less than 3 ms-1 • precision better than 4 ms-1 (1σ): 0 – 20 ms-1 • precision better than 8 ms-1 (1σ): 0 – 35 ms-1 • Measurements with peak winds in 40 – 60+ ms-1 range: • bias (underestimate) less than 8 ms-1 • precision better than 9 ms-1 (1σ) • Significant underestimates primarily of winds in hurricane eyewall • Future • Reduce bias in peak wind/eyewall measurements and improve precision for P-3 hurricane/TC missions. • GPS wind speed assimilation in intensity forecasting (or other) models • Data product quality control and accuracy, precision reqt’s • Add missions/platforms for wind field mapping of developing storm systems.
Dr. James McFadden (AOC Chief, Programs and Projects) Terry Lynch (Chief, Technical Section) Joe Bosko (N42RF Science systems) Dana Naeher(N43RF Science systems) Acknowledgements ~ For the excellent support ~ Thank you !!