Download

1 / 1
10 likes | 416 Views
Consequences Of Non-Compliance To Osteoporosis Medication Among Osteoporotic Women Ankita Modi , Ph.D , M.D. 1 , Jackson Tang, M.Sc. 2 , Shuvayu Sen , Ph.D . 1 1 Health Outcomes, Merck & Co., NJ , 2 AsclepiusJT LLC, NY. Poster Session I ID: 52370. Results

E N D
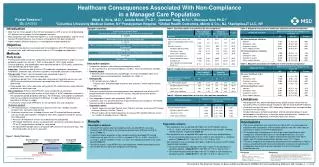
Consequences Of Non-Compliance To Osteoporosis Medication Among Osteoporotic Women Ankita Modi, Ph.D, M.D.1, Jackson Tang, M.Sc.2, ShuvayuSen, Ph.D.1 1Health Outcomes, Merck & Co., NJ, 2AsclepiusJT LLC, NY Poster Session I ID: 52370 • Results • Among 57,913 women who met eligibility criteria, 34,483 (59.5%) were non-compliant to osteoporosis therapy during year 1 (mean [SD] age, 64.2 [8.9] years). (Table 1) • Non-compliant patients also experienced significantly more hospitalization events (12.3% vs. 9.6%), emergency room (ER) events (12.4% vs. 11.1%) and frequent OP-related hospital stays (0.03 vs. 0.02) during year 2 (all p<0.01). (Table 2) • Compared to compliant patients (N=23,430 (40.5%)), a significantly higher proportion of non-compliant patients developed vertebral (0.79% vs. 0.48%), hip (0.42% vs. 0.25%) and non-vertebral (1.93% vs.1.52%) fractures during year 2. (Table 3) • Introduction • More than 40 million people in the US have osteoporosis (OP) or are at risk for developing OP, placing them at greater risk of bone fractures. • Poor compliance with osteoporosis treatment regimens is a well-recognized problem, and the risk of having osteoporotic-related fractures increases among patients with poor compliance. • Higher medical costs is also a consequence of poor compliance. • Objective • To examine consequences associated with non-compliance to osteoporosis (OP) medication in terms of fracture rates and healthcare resource utilization • Methods • Study design • A retrospective cohort study was conducted using i3 Invision Datamart; a large U.S. claims database records from January 1, 2001 to December 31, 2010 (study window). • Index date: The date of initiation of first OP medication (alendronate, ibandronate, risedronate, zoledronate, raloxifene, calcitonin, teriparitide) during the study window. • Compliance: Defined as having a medication possession ratio (MPR) > 0.8 • MPR was defined as the total number of days’ supply of all OP mediation received in the compliance period, divided by 365 days. • Study outcome: OP-related fractures and healthcare resource utilization • OP-related fractures: included non-traumatic fractures occurred at the hip, vertebral, and non-vertebral sites. • Healthcare resource utilization: Medical (Inpatient, Outpatient, ER, and Other) and Pharmacy • Study period: Consisted of three consecutive, one-year time periods (Figure 1): • Baseline period: 1 year prior to the index date • Compliance period: Year 1 after index date, during which compliance with osteoporosis treatment was calculated • Study period: Year 2 after index date, during which study outcomes were measured • Disease diagnoses and comorbidities were identified based on ICD-9 codes, medications were identified based on NDC codes. • Study sample • Inclusion: • Prescribed with > 1 OP mediation in the study window • Female aged > 55 as of index date • > 12 months pre- and > 24 months post-index continuous eligibility • Exclusion: • Paget’s disease ever in the claims history • Diagnosis of malignant neoplasm during the study period Table 3. Study Period Fracture Rates • Multivariate Results • Non-compliance was associated with higher OP-related fractures (Table 4) • 19%, 43%, and 47% more likely to experience any fractures, vertebral, and hip fractures, respectively. • Non-compliance was associated with more frequent inpatient events • 16% more likely to experience > 1 inpatient visit, 95% CI: [1.10, 1.23] (Table 5) • 27% more likely to have an additional inpatient event, 95% CI: [1.19, 1.33] (Table 6) Table 1. Patient characteristics in the Baseline period Table 4. Association of Fracture Rates and Treatment non-compliance Table 5. Association of healthcare resource and Treatment non-compliance Patients initiating OP treatment The initiation of the first BIS is defined as the Index Date N = 686,505 Table 6. Association of healthcare events nd Treatment non-compliance Figure 2. Sample selection Table 2. Study Period Healthcare utilization Female age >55 as of index date N= 488,361 Figure 1. Study period • Data analysis • Baseline period: patient characteristics • Study period: • OP-related fractures • Fracture rates (% of patients with fractures), by fracture type • All-cause and OP-related health care resource • OP-related health care events • Multivariate analysis • Key independent variable: non-compliance (MPR < 0.8) • Covariates: Age, presence of GI symptoms at baseline, OP-related fractures at baseline, CCI, and presence of other comorbidities at baseline • Fracture rates: Logistic regression • All-cause resource utilization (Yes/No): Logistic regression • All-cause number of resource use: Gamma regression • Conclusions • Rate of non-compliance was found to be high in a managed care population with osteoporosis. As a result, rate of osteoporotic fractures and healthcare utilization was substantially higher for patients who were non-compliant. • The results emphasize the importance of good treatment compliance in order to achieve a treatment benefit and thereby reduce the burden that osteoporosis and associated fractures place on individuals and healthcare systems. Patients with>12-month continuous eligibility before and >24-month of continuous eligibility after the index date N = 87,235 Exclude patients with malignant neoplasm or Paget’s disease of bone N = 57,913 • Disclosure • Author(s) of this presentation have the following to disclose concerning possible financial or personal relationships with commercial entities that may have a direct or indirect interest in the subject matter of this presentation: • Ankita Modi: Employee – Merck & Co. • Jackson Tang: Consultant – Received research funding from Merck & Co. • ShuvayuSen: Employee – Merck & Co. Naive to all osteoporosis treatment Presented at The DIA 2013 49th Annual Meeting, Boston, MA, June 22 – June 27, 2013. TOTAL SAMPLE = 57,913 Compliance period (12-months) Baseline period (12-months) Study period (12-months) MPRcalculated OP-related fractures and resource utilization assessment Index Date Initiation of OP medication