Download

1 / 24
260 likes | 491 Views
Drought. Relevance . Case Studies India Australia Western United States. Table 1: Drought & Sustainability by Dave Chaney & Chuck Ingels , SAREP, Spring, 1991 (v3n3), sustainable agriculture. www.strangecosmos.com/. www.waterencyclopedia.com. earthobservatory.nasa.gov. Background.

E N D
Relevance • Case Studies • India • Australia • Western United States Table 1: Drought & Sustainability by Dave Chaney & Chuck Ingels, SAREP, Spring, 1991 (v3n3), sustainable agriculture www.strangecosmos.com/ www.waterencyclopedia.com earthobservatory.nasa.gov
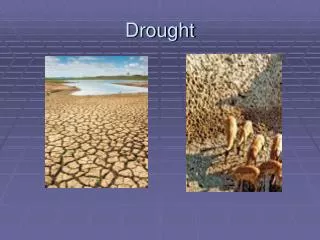
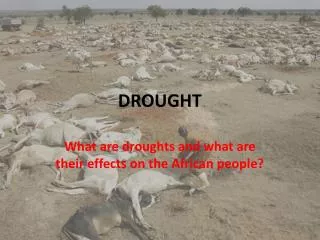
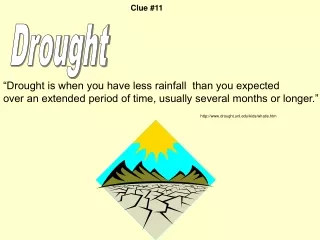
Background • What is drought ? • Physical phenomena: compression warming (or sinking of air) which inhibits cloud formation
Background • What is drought ? • Physical phenomena: compression warming (or sinking of air) which inhibits cloud formation • Defined by impacts: • Meteorological • Hydrologic • Socioeconomic • Agricultural
Background • How is drought quantified? • Drought indices: varied metrics that integrate drought characterisitics • Percent of Normal • SPI • SWSI • RDI • Deciles • CMI • PDSI • Drought Monitor http://drought.mssl.ucl.ac.uk/graphics/drought_class3.png
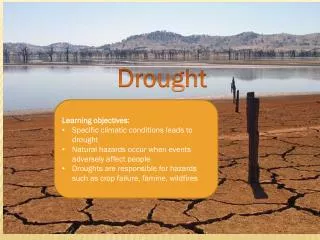
Life of a drought (LAD) • How frequent are droughts?
Life of a drought (LAD) • How frequent are droughts? • Where will a drought live?
Life of a drought (LAD) • How frequent are droughts? • Where will a drought live? • How intense is the drought? • How long will a drought live?
Data Set • PDSI • Texas region 7 • Monthly from 1900-2009 • http://gis.ncdc.noaa.gov/website/ims-cdo/div/viewer.htm
Data Set • PDSI • Texas region 7 • Monthly from 1900-2009 • Drought Monitor • Shape Files • Texas • USA • Weekly from 2000-2009 • 0 to 4 • http://gis.ncdc.noaa.gov/website/ims-cdo/div/viewer.htm
Statistical Methods • Descriptive statistic s • Mean, max and min • Regression • Trends with droughts over time • Multivariable regression • Trends with precipitation and temperature • Probability distribution • Test for normality • Chi squared • Cumulative Distributions • Normal and Poisson
Analysis: PDSI • Trends? • Regression Results
Analysis: PDSI • Is the data Normal? • Chi Squared test Mean = 0; STDV = 2.5 Theoretical: 1222 ; Observed: 47OK Cannot reject null hypothesis with 95% confidence
Analysis: PDSI • Normal probability density function • Drought < -3 • Prob [ X< -3] = 13% • Is the data Normal? Mean = 0; STDV = 2.5 Theoretical: 1222 ; Observed: 47OK Cannot reject null hypothesis with 95% confidence
Analysis: PDSI • Prob [ X< -3] = 13% • Poisson distribution
Analysis: PDSI • PDSI • How long does a drought live? • μ = 5 months (invlog) • Is the data Lognormal? Theoretical: 41; Observed: 10 OK Cannot reject null hypothesis with 95% confidence
Analysis: Drought monitor • Texas • Austin
Analysis: Drought Monitor • > D2 (severe-exceptional) Average: 18%
Analysis: Drought Monitor • > D2 (severe-exceptional) Average: 18% Average: 18%
Analysis: Drought Monitor • > D2 (severe-exceptional) Average: 18% Average: 18% Average: 10%
Conclusion • No statistically significant temporal trends • 13% chance that a severe drought will occur in any given month • Average area covers 18% of the state (similar to national average)
Conclusion • No statistically significant temporal trends • 13% chance that a severe drought will occur in any given month • Average area covers 18% of the state (similar to national average) • Future Work • Seasonal variations • El Nino • More spatial analysis of the drought monitor
Question Yeah…I’m hot, So?