Download
1 / 18
200 likes | 359 Views
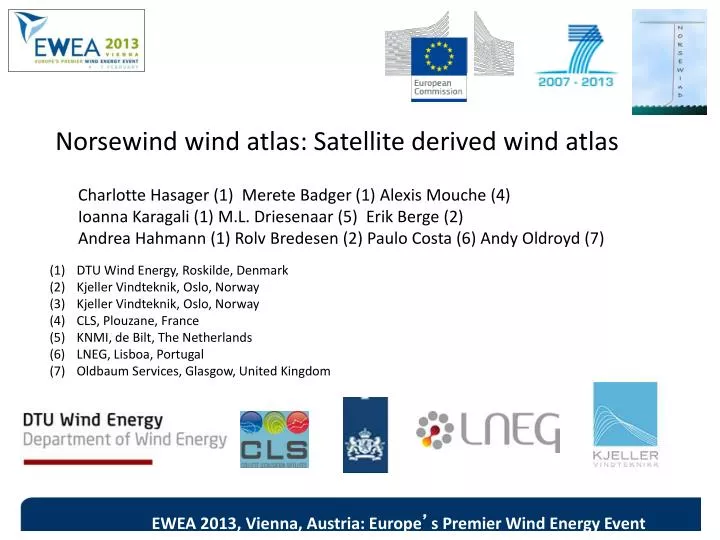
Norsewind wind atlas: Satellite derived wind atlas. Charlotte Hasager (1) Merete Badger (1) Alexis Mouche (4) Ioanna Karagali (1) M.L. Driesenaar (5) Erik Berge (2) Andrea Hahmann (1) Rolv Bredesen (2) Paulo Costa (6) Andy Oldroyd (7). DTU Wind Energy, Roskilde, Denmark

E N D
Norsewind wind atlas: Satellite derived wind atlas Charlotte Hasager (1) Merete Badger (1) Alexis Mouche (4) Ioanna Karagali (1) M.L. Driesenaar (5) Erik Berge (2) Andrea Hahmann (1) Rolv Bredesen (2) Paulo Costa (6) Andy Oldroyd (7) DTU Wind Energy, Roskilde, Denmark KjellerVindteknik, Oslo, Norway (3) KjellerVindteknik, Oslo, Norway (4) CLS, Plouzane, France KNMI, de Bilt, The Netherlands LNEG, Lisboa, Portugal (7) Oldbaum Services, Glasgow, United Kingdom EWEA 2013, Vienna, Austria: Europe’s Premier Wind Energy Event
Introduction The FP7 project Norsewind (2008-2012) focused on the offshore winds through observations with ground-based lidar offshore meteorological masts satellite remote sensing mesoscale modeling One of the key products is wind atlas based on satellite data. EWEA 2013, Vienna, Austria: Europe’s Premier Wind Energy Event
Rationale for satellite data EWEA 2013, Vienna, Austria: Europe’s Premier Wind Energy Event
Satellite SAR – synthetic aperture radar EWEA 2013, Vienna, Austria: Europe’s Premier Wind Energy Event
EWEA 2013, Vienna, Austria: Europe’s Premier Wind Energy Event
EWEA 2013, Vienna, Austria: Europe’s Premier Wind Energy Event
EWEA 2013, Vienna, Austria: Europe’s Premier Wind Energy Event
EWEA 2013, Vienna, Austria: Europe’s Premier Wind Energy Event
From : EWEA 2012 M. Badger, A. Peña, R. Bredesen, E. Berge, A. Hahmann, J. Badger, I. Karagali, C. Hasager, T.Mikkelsen, Bringing satellite winds to hub-height, Proceedings. EWEA 2013, Vienna, Austria: Europe’s Premier Wind Energy Event
QuikSCAT winds <5 m/s winds >15 m/s EWEA 2013, Vienna, Austria: Europe’s Premier Wind Energy Event
QuikSCAT – spatial correlations Horns Rev M2 FINO-1 Egmond aan Zee Greater Gabbard. EWEA 2013, Vienna, Austria: Europe’s Premier Wind Energy Event
QuikSCAT versus four met-masts Karagali, I. (2012). Offshore Wind Energy: Wind and Sea Surface Temperature from Satellite Observations. PhD Thesis, DTU Wind Energy-PhD-003. GG is Greater Gabbard EAZ is Egmond an Zee EWEA 2013, Vienna, Austria: Europe’s Premier Wind Energy Event
ASCAT versus WRF (wind speed) Number of ASCAT passes used for comparisons with the WRF model outputs (left) and mean bias between ASCAT and WRF. EWEA 2013, Vienna, Austria: Europe’s Premier Wind Energy Event
ASCAT and QuikSCAT scatterometer mean wind speed EWEA 2013, Vienna, Austria: Europe’s Premier Wind Energy Event
Access to wind ressource maps Maps at http://geoportal.lneg.pt//index.php?lg=en&state=Inicio. The results are based on 9000 Envisat ASAR WSM wind maps collected and processed by CLS and DTU Wind Energy. Also QuikSCAT and ASCAT maps are available and WRF results. See www.norsewind.eu • The maps are • Number of samples • Mean wind speed • Weibull A parameter • Weibull k parameter • Energy density EWEA 2013, Vienna, Austria: Europe’s Premier Wind Energy Event
Access to wind ressource maps Maps at http://soprano.cls.fr soprano/winds/statistics(L3) select Norsewind. The results are based on 9000 Envisat ASAR WSM wind maps collected and processed by CLS and DTU Wind Energy. • The maps are • Number of samples • Mean wind speed • Weibull A parameter • Weibull k parameter • Energy density EWEA 2013, Vienna, Austria: Europe’s Premier Wind Energy Event
Access to wind ressource maps Baltic Sea Norwegian Sea Irish Sea North Sea EWEA 2013, Vienna, Austria: Europe’s Premier Wind Energy Event
Conclusions • Based on satellite SAR and scatterometer Earth Observations maps of many statistical parameters are calculated including mean wind speed, Weibull A and k, uncertainty estimates, spatial correlation, etc. • Comparison to met-mast data and WRF results performed • Lifting of satellite winds to hub-height is on-going (beyond the project) • The satellite-based wind ressource maps for 10 m height are publically available at • http://soprano.cls.fr • http://geoportal.lneg.pt//index.php?lg=en&state=Inicio • www.norsewind.eu • Report: Hasager et al. 2012 Norsewind satellite wind climatology, DTU Wind Energy-E-0007(EN), Roskilde, Denmark EWEA 2013, Vienna, Austria: Europe’s Premier Wind Energy Event