Download
1 / 29
290 likes | 400 Views
HIV/AIDS Epidemiology Update February 2009. Dr Nigel Dickson Director, AIDS Epidemiology Group Department of Preventive and Social Medicine University of Otago, Dunedin. Update data on HIV diagnoses through antibody testing 2008 figures and trends – 1999-2008 New analyses Ethnicity

E N D
HIV/AIDS Epidemiology Update February 2009 Dr Nigel Dickson Director, AIDS Epidemiology Group Department of Preventive and Social Medicine University of Otago, Dunedin
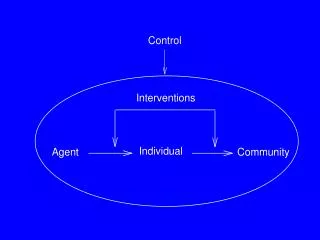
Update data on HIV diagnoses through antibody testing • 2008 figures and trends – 1999-2008 • New analyses • Ethnicity • “Late testers” • Mention new project • Follow up questionnaires
2008 figures and trends in people diagnosed with HIV through antibody testing – 1999-2008 Care with data … • Year of diagnosis not infection • Not all infected in New Zealand will have been diagnosed • Some infected people (most diagnosed initially overseas) do not have an antibody test in NZ • the data on these people captured through viral load testing
Diagnosed HIV – through antibody testing – by year of test Year of Diagnosis
Annual number of men diagnosed, infected through homosexual contact (MSM)
MSM diagnosed with HIV – 1999-2008 Place of infection Place of residence at diagnosis Age at diagnosis Ethnicity
Men and women diagnosed infected through heterosexual contact
Heterosexually infected men and women diagnosed with HIV – 1999-2008 Place of infection Place of residence at diagnosis Age at diagnosis Ethnicity
International comparison of MSM diagnosis rates – 2000-6 Care with data… • Different patterns of HIV testing may exist • Rates of diagnosis derived from number of all men not MSM • Data recently published from 27/30 european (EU/EFTA ) countries • Canadian, Australian and US data from national surveillance reports
HIV diagnosis rate among MSM in major Western European countries + Australia, Canada, US and New Zealand Per million men aged 15-64yr
Ethnicity among people diagnosed with HIV through antibody testing • Information collected from clinician • Recent decade - 1999-2008 • Care with data… • How ethnicity is determined • Rates of testing • Relatively small numbers
Comparing disease between ethnic groups 1999-2008 Derive and compare rates • Numerator from clinician, denominator from census We have looked at… • …overall comparison of diagnosis rates as an indication of newly recognised burden in these populations • …comparison of age adjusted rate of diagnosis as a surrogate of infection risk
Comparison of rates of newly diagnosed HIV among children and adults by means of infection
Comparison of risks to predict future disease pattern in New Zealand • Use diagnosis rates as surrogates for infection rates • Need to take into account different age structures of population • Comparing age standardised rates and report as standardised incidence ratios + confidence intervals • Does the rate of infection in New Zealand give a better indication of likely future trends for infections here? • Overall SIRs and 95% CI • ‘”Infected in New Zealand” SIRs and 95% CI
Standardised incidence ratio + 95% CI People infected in New Zealand Beware of CIs as small number in reference population
Late diagnoses of HIV infection among adults in New Zealand • “Early” diagnosis of HIV infection allows… • optimal decision regarding individual’s therapy • helps in control of spread • Behaviour change • Reduction in viral load “Late” diagnosis doesn’t!
We defined “Late tester” either … • Diagnosis of AIDS around time of HIV diagnosis • Within 3/12 of each other • Initial CD4+ count ‹200 cells per µlitre
Two things influence “late testers” as a proportion of all diagnoses • Testing practices • Dynamics of underlying HIV epidemic • A higher proportion of “Late testers” found if: • Less testing of asymptomatic people • In the late-stage of a declining epidemic • (c) Both
682 HIV diagnoses among adults through antibody testing 2005-8 (initial CD4 counts first collected here in 2005) • Initial CD4 count reported for 71% (490/682) • Of these 30.6% (150/490) “late testers” Are there different proportions of “late testers” among people diagnosed by demographic and other characteristics?
“Late testers” by means of infection - 2005-8 • * Adjusted for age
Late testers among MSM 2005-8 * Adjusted for age
Late testers among heterosexual men and women - 2005-8 – work in progress
Some international comparisons † CD4<200+clinical late *CD4<200
New initiative • Follow up questionnaire with clinician 3/12 post diagnosis • Up date information • Check for AIDS diagnosis • Ask about partner notification • Clinicians asked to give questionnaire to patient for him/her to return directly to us • Circumstances of HIV acquisition (if known) • Includes the census ethnicity question
Conclusions • Worrying continuing increased level of new diagnoses • Safest to assume a reflection of new infections • Rise in diagnosis rate in New Zealand also seen in most Western European countries, US, Canada and Australia between 2000-2006 • Burden of new diagnoses not borne equally but all ethnic groups • If diagnosis rate of infections within New Zealand a surrogate for infection rates no major differences between ethnic groups among men, but among women relative to European women, women of “other” ethnic groups, Pacific and Maori women at greater risk • Late diagnosis rates slightly higher than Australia and similar to UK and France • Among MSM late diagnosis higher among Maori
My recommendations • Review current of national strategy and action for HIV prevention + surveillance • Consider when prevention needs to be specific for HIV and when it should be part of general STI prevention • Improve surveillance of other STIs to identify risks among MSM
Acknowledgements • Organisers and funders of this meeting • Funding of AEG Ministry of Health • Clinicians who provide data • Other members of AEG • Sue McAllister (Research Officer) • Charlotte Paul (Epidemiologist) • Katrina Sharples (Statistician) • Patricia Priest (Epidemiologist) www.aidsepigroup.otago.ac.nz/