Download
1 / 15
150 likes | 313 Views
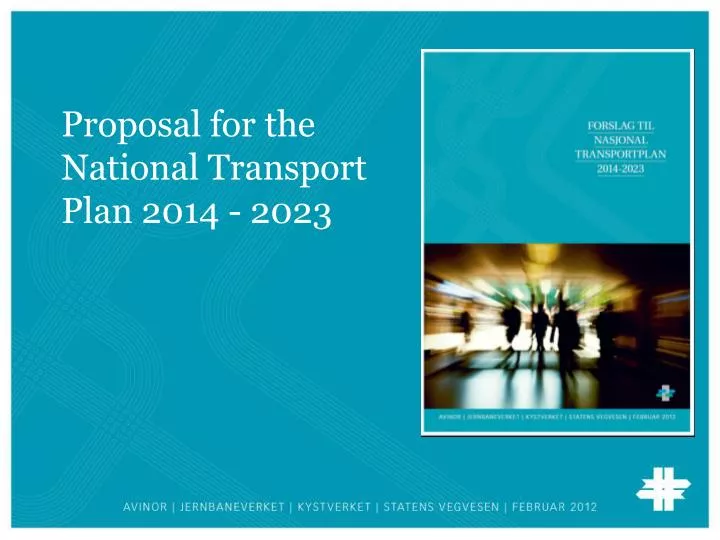
Proposal for the National Transport Plan 2014 - 2023. System of government: Constitutional monarchy Parliamentary democracy 19 Counties 429 Municipalities Area (mainland): 323 782 km2 Population: 5 million people. Norway. Key figures. Ports and fairways. Airports. Rail lines.

E N D
System of government:Constitutional monarchyParliamentary democracy 19 Counties 429 Municipalities Area (mainland):323 782 km2 Population:5 million people Norway
Ports and fairways Airports Rail lines National roads
The Norwegian Parliament (Stortinget) The Norwegian Government (Regjeringen) Ministry of Fisheries and Coastal Affairs (FKD) Ministryof Transport and Communications (SD) Avinor AS (Norwegian air traffic authority) Norwegian Public Roads Administration (Statens vegvesen) Norwegian National Rail Administration (Jernbaneverket) Norwegian Coastal Administration (Kystverket)
Official Steering Documents National Transport Plan (10 Year Period) Action Programme (Focus on first 4 Years) Annual National Budget Appropriation Projects
National Transport Plan 2014 - 2023 • Major challenges: • Globalisation • Population growth • Economic growth • Traffic safety • Emissions and climate change
Globalisation Volume of world trade 1965-2010 Million US Dollar in current prices Source: WTO
Population growth Population development in Norway. Number of years between each increment of one million. Source: SSB Growing cities Aging population Negative Positive, less than the national average Positive, more than the national average National average: 1.1 per cent The size of the circles indicates population size in each municipality Other major urban areas Surrounding area of the four largest cities The four largest cities Other areas Average population change per year. Municipalities 2005-2009. Source: Statistics Norway Map: Norwegian Mapping Authority 0-19 years 20-66 years Over 67 years Number of inhabitants in 2011 and 2040 – by age for the largest cities and other areas. Source: SSB
Traffic safety Many actors must be involved • Ambitious goals for road traffic safety • The number of fatalities and serious injuries to be reduced by half by 2024 • 100/500 Other accidents Accidents involving pedestrians Driving off the road Head-on collisions National road County road Municipal road Private road Average number of fatalities and serious injuries per year in the period 2007-2010, by road category and type of accident.
Norway – a carbon neutral society by 2050 Reduce emissions from the transport sector by at least 2.5-4 million tonnes CO2 equivalent by 2020 compared with the baseline scenario Various measures, including: • Expansion of railways and other public transport modalities • Cargo transport by ship and rail • Research and development to support more climate-friendly transport and distribution of biofuels Substantial impact requires effective measures
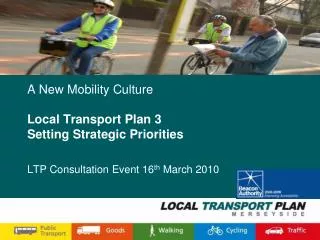
The cities • Growth must be absorbed by public transport, walking and cycling • Concentrated use of space • Strong emphasis on • Buses • Urban rail, trams, metros • Railways • Road network for pedestrians and cyclists • Restrictions on car use
Strong regions and more efficient inter-regional transport • Roads • Rail • Airports • Fairways and ports Some examples: • InterCity rail strengthens the Eastern region • Expanded capacity at Bergen Airport Flesland • Shipping fairway to Bergen One-hour travel distance today One-hour travel distance after expansion
Financial framework1 EUR = ~8 NOK NTP 2014-2023; alternatives NOK million (in 2011 kroner) Toll revenue Major projects Programme areas etc. Upgrading/maintenance Administration Maintenance Operations NTP NTP 2014-2023 2010-2019 -20% Base +20% +45%