Download
1 / 20
200 likes | 290 Views
Improving the sensitivity of searches for an association between Gamma Ray Bursts and Gravitational Waves. Soumya D. Mohanty The University of Texas at Brownsville Acknowledgement: Exttrigg group for helpful discussions. Gamma Ray Bursts. Beamed Gamma Ray emission Followed by afterglow.

E N D
Improving the sensitivity of searches for an association between Gamma Ray Bursts and Gravitational Waves Soumya D. Mohanty The University of Texas at Brownsville Acknowledgement: Exttrigg group for helpful discussions
Gamma Ray Bursts • Beamed Gamma Ray emission • Followed by afterglow • Relativistic ejecta • Internal and/or • external shocks Black Hole accreting rapidly Gamma Ray Burst Central Engine Intrinsic delay depends on where shocks form • Gravitational wave emission • formation, activity and decay of central engine • Neutrino etc. • Possible progenitors • Core collapse of massive, high angular momentum stars • Merger of NS stars • Estimates • Kobayashi, Meszaros, ApJ, 2002: 1 collapsar/year, marginal, Adv LIGO • Van Putten et al, PRD, 2004: 0.2 M in GWs GWDAW9
Detectability • Cosmological distances: direct detection unlikely • XRFs, weaker GRBs could be off-axis and close by • Detect association : Accumulate SNR over several GRBs • Finn, Mohanty, Romano, PRD, 1999 (FMR) • Deep searches possible • Matched filtering SNR = hrmssignal duration / PSD (white) • FMR 95% UL: hrms 210-23, 1000 GRBs, PSD=310-24, 100 Hz band 10msec signal, Integration length=0.5 sec • Matched filtering SNR ~ 2.0 • Accumulation algorithms: observational constraints • Astone et al, 2002, 2004 GWDAW9
Objective Explore ways to improve the sensitivity of FMR FMR works by • Cross-correlating pairs of segments for every GRB trigger (on-source sample) … • and also away from any GRB (off-source samples) • Testing for a statistically significant difference in the sample means of on- and off source distributions • Virtue: eliminate any weak common terrestrial signal GWDAW9
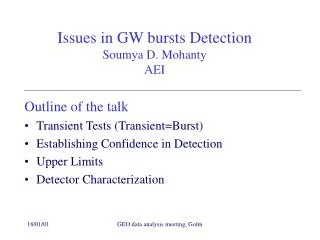
Main limitation of FMR Unknown delay between GRB and GW • cross correlation integration length set equal to max expected delay • ~ 1 to 100 sec >> typical expected burst signal duration of ~ 100 msec GWDAW9
Likelihood Ratio Approach • What is the maximum likelihood ratio statistic for • Gaussian, white noise & Independent (co-aligned) detectors • Signal with unknown waveform, time of arrival ta and duration • Key point: consider signal time samples as parameters to be maximized over • Frequentist version of similar calculations (Anderson et al, Vicere) carried out in a Bayesian framework • Note: no formal proof of optimality exists for max LR. However, often performs the best. GWDAW9
Results • Known ta, • Maximum LR statistic : <x1,x1>/2+<x2,x2>/2+<x1,x2> • Only the cc term is retained : non-Gaussianity of real data • Can be generalized to a network of misaligned detectors • W. Johnston, Master’s thesis, UTB, 2003 • Unknown ta and • Cross-correlate sec (M < N samples) subsegments • CORRGRAM (Mohanty et al, Proc GWDAW8; R-statistic / CORRPOWER, Cadonati, Marka, Poster, this conference) GWDAW9
CORRGRAM x1 x2 GWDAW9
Unknown ta and cont… • However : we are also searching over unknown waveforms • The scan over max should cover smaller automatically • Only one scan needed in integration length • No formal proof yet (also note on optimality of LR) • FMR fits in : max waveform duration same as integration length GWDAW9
Extend to Multiple triggers • Unknown time of arrival and duration for each trigger • Max LR statistic : • Final statistic : Sum of individual maxima GWDAW9
LR inspired alternatives to FMR • Max of CORRGRAM for each trigger, rank-sum test for shift in median between on- and off-source samples (common signal subtraction preserved) • Same but scan with a single value of duration ( M) • Appears to follow from the full application of LR • MULTICFT: uses CORRGRAMs for each trigger GWDAW9
MULTICFT • Multi-trigger Corrgram FFTs 2 D FFT • The “signal” in the corrgram is shifted to low frequencies apart from a phase factor. • Magnitude : gets rid of the phase factor • Average the FFTs across multiple triggers • Integrate out the power along a narrow vertical strip near the origin • Max of integrated power is the test statistic GWDAW9
Metric for comparison • What is the expected 90% UL for a given matched filtering SNR (Euclidean norm of the signal) ? lower Uls are better • Subtlety: UL is an estimator. Integrating the bulk of the test statistic pdf, not its tail. • Monte Carlo simulation: • Each trial is a full analysis with NGRB GRBs • Fixed signal waveform and Euclidean norm (Matched filtering SNR in white noise) • Randomly distributed times of arrival for each trigger • One test statistic value for each trial • 10th percentile of test statistic sample : 90% confidence level upper limit confidence belt • Mean of test statistic sample: read off UL from confidence belt GWDAW9
Confidence belt Mean UL 90% mean Mean GWDAW9
Comparison MULTICFT FMR • Total segment length = 5 sec@1024Hz • Sine-Gaussian: 256Hz, =0.05 sec • Number of GRBs = 50 • Integration lengths: 20 to 100 msec in steps of 10msec GWDAW9
Comparison cont … • Total segment length = • 2 sec@1024Hz • Sine-Gaussian: 256Hz, =0.05 sec • Number of GRBs = 100 • Integration lengths: 100 msec FMR MAX CORRGRAM Single integration length GWDAW9
Comparison cont … • Total segment length = • 10 sec@1024Hz • Sine-Gaussian: 256Hz, =0.05 sec • Number of GRBs = 100 • Integration lengths: 100 msec FMR MAX CORRGRAM Single integration length GWDAW9
Comparison cont… FMR MAX CORRGRAM Single integration length • Total segment length = • 30 sec@1024Hz • Sine-Gaussian: 256Hz, =0.05 sec • Number of GRBs = 100 • Integration lengths: 100 msec GWDAW9
Comparison cont … FMR SINGLE MAX CORRGRAM Single integration length • Total segment length = • 10 sec@1024Hz • Sine-Gaussian: 256Hz, =0.05 sec • Number of GRBs = 100 • Integration lengths: 100 msec GWDAW9
Summary and Conclusions • Objective: Improve the sensitivity of FMR for the (expected) case of signal duration << delay range. • Max. Likelihood Ratio as a guide – further refinements in its application are possible • Improvement possible: Rank Sum, two sample test with a single integration length performs better than FMR in all cases • This strategy also follows from the max LR statistic • Limited study so far – ratio of signal to data length, max integration length, number of GRBs • Obtain analytic approximations GWDAW9