Download
1 / 35
410 likes | 1.01k Views
Aug, 17, 2011 . Introduction of Cohort Study. Hirohide Yokokawa, M.D., Ph.D. Department of General Medicine, Juntendo University School of Medicine. Contents. What is Cohort Study? Overview of study design Purpose of Cohort study Types of Cohort Studies

E N D
Aug, 17, 2011 Introduction of Cohort Study Hirohide Yokokawa, M.D., Ph.D. Department of General Medicine, Juntendo University School of Medicine
Contents • What is Cohort Study? • Overview of study design • Purpose of Cohort study • Types of Cohort Studies • Prospective and Retrospective • Procedure of Cohort Study. • Follow up and Risk assessment • An Example of Cohort Study.
Overview of study designs Clinical studies
Purpose of Cohort Study To determine whether there is an association between a factor and development of a disease. To derive an appropriate interference regarding with a possible causal relationship.
Advantage and Disadvantage of Cohort Study compared to Case-Control study
Review feasibility of the planed study considering with study question, target disease, expose, cost, expected study period , etc!
Procedure of Cohort Study ① Define Study Participants NOT EXPOSED EXPOSED ② ③ ④ DISEASE DEVEPOPS DISEASE DEVEPOPS DISEASE DOSE NOT DEVEPOPS DISEASE DOSE NOT DEVEPOPS
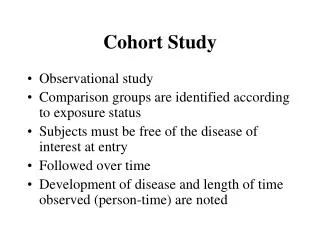
Define eligible Study Participants • The investigator selects a group of EXPOSED individuals and a group of NON EXPOSED individuals • Follow up both groups • Compare incidence of disease
Follow up • To obtain data about outcome to be determined (morbidity or death) • Mailed questionnaire, telephone calls • Periodic medical examination • Reviewing records • Surveillance of death records • Follow up is the most critical part of the study • Some loss to follow up is inevitable due to death change of address, migration, change of occupation. • Loss to follow-up is one of the draw-back of the cohort study.
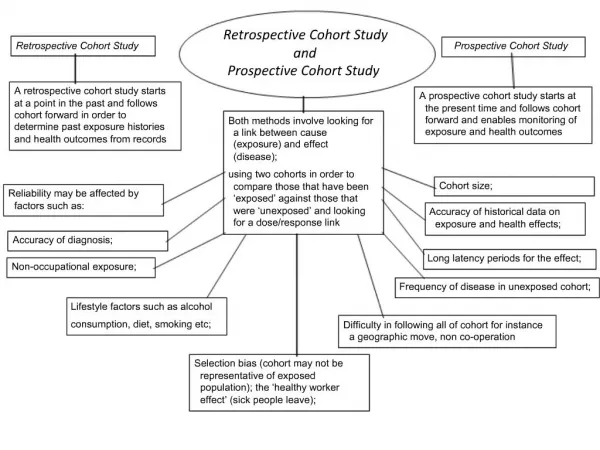
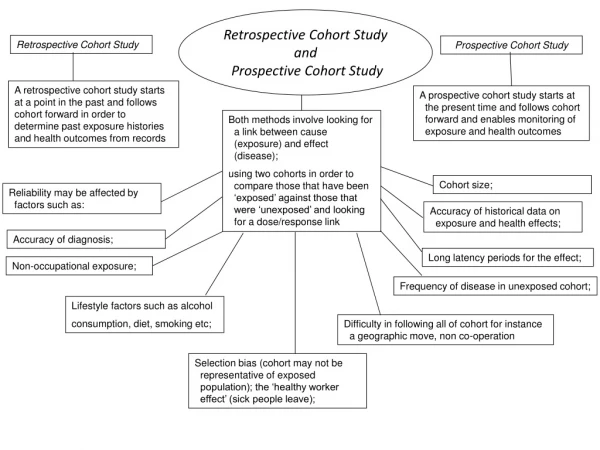
Types of Cohort studies • Prospective • Retrospective
Time course of Cohort studies NOW EXPOSE OUTCOME Collect Information Measure Outcome EXPOSE OUTCOME Time
Retrospective Cohort Study (10 years follow-up) 2001 (10 years ago) Study Participants NOT EXPOSED EXPOSED DISEASE DEVEPOPS DISEASE DEVEPOPS DISEASE DOSE NOT DEVEPOPS DISEASE DOSE NOT DEVEPOPS 2011 (Now)
Prospective Cohort Study (10 years follow-up) 2011 Now Study Participants NOT EXPOSED EXPOSED DISEASE DEVEPOPS DISEASE DEVEPOPS DISEASE DOSE NOT DEVEPOPS DISEASE DOSE NOT DEVEPOPS 2021
Advantage and Disadvantage of Prospective and Retrospective Cohort Study
Risk measurement in Cohort Study DISEASE NOT PRESENT DISEASE PRESENT EXPOSED a b Follow-up c d NOT EXPOSED Risk in EXPOSED Risk in NOT EXPOSED a/(a+d) c/(c+d) = Relative Risk (RR)=
An Example of Cohort Study and A Case of Publishing Data
Gaps between hypertension treatment guidelines and practice in Japan Fukushima Research of Hypertension ~(FRESH)~ Hirohide Yokokawa,Aya Goto,Hironobu Sanada, Tsuyoshi Watanabe,Robin A. Felder, Pedro A. Jose, Seiji Yasumura
Introduction of our Cohort study Fukushima Research of Hypertension (FRESH) Research Design Observational Cohort Study (from July 2006 to May 2007) Subjects Subjects were 3,358 registered hypertensive patients who received antihypertensive medication by 72 physician members of Fukushima Hypertension Conference.
Aim of the study To determine Hypertensive patients’ characteristics Success rates in achieving goal blood pressures Factors associated with therapeutic failures for target treatment goals among Japanese hypertensive patients. Fukushima prefecture
Time Course of the Study Summer Autumn Winter Spring 夏 2006-July Registration 2006-October 1st Follow-up 2007-Janualy 2st Follow-up 2007-April 3st Follow-up Fulfill Registration form and collect basic information Fulfill Follow-up form and collect follow-up data Return these forms by mail
Analysis of Baseline Data (Cross-sectional analysis) Gaps between hypertension treatment guidelines and practice in Japan ~Baseline survey results from Fukushima Research of Hypertension (FRESH)~ J Clin Hypetens 2009; 11:333-341.
To assess the possible factors associated with the focused outcomes using baseline data.
Table.1 Association of blood pressure achievement failure in elderly patients without DMa) or RDb)(multivariate logistic regression analyses) *<0.05, **<0.01 a)Diabetes mellitus, b)Renal disease c) 85 or higher for Men, 90 or higher for Women
Table.2 Association of blood pressure achievement failure in young and middle aged patients without DMa) or RDb)(multivariate logistic regression analyses) *<0.05, **<0.01 a)Diabetes mellitus, b)Renal disease
Table.3 Association of blood pressure achievement failure in patients with DMa) or RDb)(multivariate logistic regression analyses) *<0.05, **<0.01 a)Diabetes mellitus, b)Renal disease
Caution! It is limited to interpret causal relationship in cross-sectional data. Need longitudinal data analysis to access causal relationship.
Analysis of Follow-up Data (Longitudinal analysis) Longitudinal community-based assessment of blood pressure control among Japanese hypertensive patients: Fukushima Research of Hypertension (FRESH) J Clin Hypetens 2010;12:166–173.
Flow of registered patients 3358 registered initially 38 excluded due to missing data or lack of medication use 3320 followed through a year 585 excluded due to lost follow up or missing data 2735 continued and confirmed their medical information Follow-up rate 82.6% 1318 Elderly Patients without DMa) or RDb) 937 DMa) and RDb) 480 Young or Middle aged Patients without DMa) or RDb) a)DM; Diabetes mellitus, b)RD; Renal disease.
Table 1. Proportions of year-round failure and success in achieving blood pressure goals. a)DM; Diabetes mellitus, b)RD; Renal disease
Table 3-1. Risk factors for failure to meet blood pressure goals in elderly patients without DMa) or RDb) across all seasons. (multivariate logistic regression analysis) **<0.01 a)DM; Diabetes mellitus, b)RD; Renal disease
Table 3-2. Risk factors for failure to achieve blood pressure goals in young or middle aged patients without DMa) or RDb)across all seasons. (multivariate logistic regression analysis) a)DM; Diabetes mellitus, b)RD; Renal disease **<0.01
Table 3-3. Risk factors for failure to achieve blood pressure goals in patients with DMa) or RDb) across all seasons. (multivariate logistic regression analysis) a)DM; Diabetes mellitus, b)RD; Renal disease
The Odds Ratio in Cohort Study Odds in Atherosclerosis complications Odds in NOT Atherosclerosis Complications a/b c/d = Odds Ratio (OR)=