Download
1 / 28
280 likes | 357 Views
Development of a Regional Scale Tool to Assess Riparian Integrity in Austin, Texas. Society for Ecological Restoration, Texas Chapter & Texas Riparian Association November 2, 2013 Aaron Richter City of Austin, Watershed Protection Department. Outline. Index of Riparian Integrity

E N D
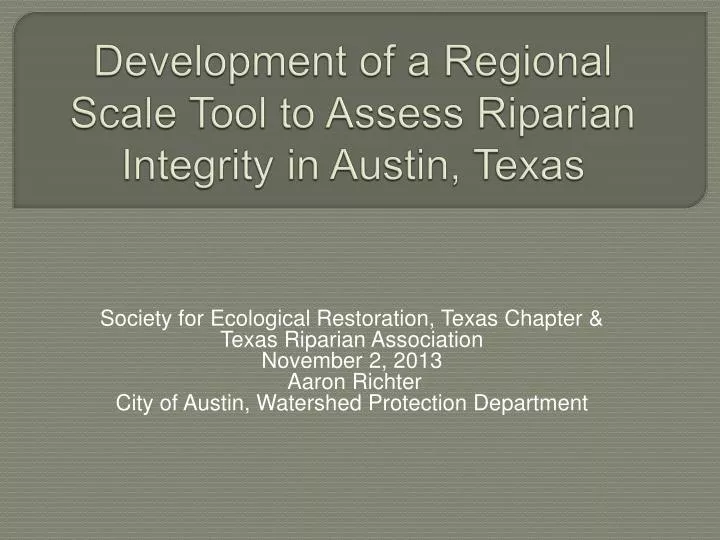
Development of a Regional Scale Tool to Assess Riparian Integrity in Austin, Texas Society for Ecological Restoration, Texas Chapter & Texas Riparian Association November 2, 2013 Aaron Richter City of Austin, Watershed Protection Department
Outline • Index of Riparian Integrity • City of Austin Riparian Assessments • Building the Model • Integrity Indicator • Variables • Spatial Component • Model Selection • Model Results • Questions
Index of Riparian Integrity (IRI) Macro-scale model based on aerial photography and land use data to assess and quantify the riparian integrity in Austin, TX
City of Austin Assessment and Prioritization of Riparian Areas • Assessment includes water quality, sediment stability, and riparian vegetation scores • Assessment performed at one site for an entire reach
Model Environmental Integrity Indicator Explanatory Variables: Landscape Values Error Weighting Matrix y = X
Model Index Environmental Integrity Indicator y = X
Model Explanatory Variables: Landscape Values y = X
LITTLE BARTON CREEK Robust Vegetation Sparse Vegetation Shadow Impervious Cover Woody Vegetation Water
LITTLE BARTON CREEK Multi Family Single Family Community Agriculture/Undev Manufacturing Utilities/Roads Office Park/Preserve Commercial
Model Weighting Matrix y = X
LITTLE BARTON CREEK LBA2 LBA3 LBA1
Model Selection Single variable of most significance was Woody Vegetation in the 50ft buffer in small drainage areas (64-320 acres). General Linear Models were compared via BIC, Adjusted R2 Multicollinearity and model diagnostics were compared for top models
Model Parameters *Small = 64-320acres, Medium = 320-640acres, Large = >640acres
Poor [25-37] Marginal [38-50] No Score Very Good [76-87] Good [63-75] Fair [51-62]
Acknowledgements • Mateo Scoggins and Surface Water Team • City of Austin, Environmental Resource Mgmt. • Jon Meade and Kathryn Murray • City of Austin, Policy and Planning