Download

1 / 75
760 likes | 919 Views
Social Policy toward Population Change . Chompoonuh K. Permpoonwiwat, Ph.D. School of Economics and Public Policy Srinakharinwirot University Bangkok, THAILAND. Topics . Population Change : A Case of Thailand Ageing Population: Celebration/Challenge? Social Policy/Programs?.

E N D
Social Policy toward Population Change Chompoonuh K. Permpoonwiwat, Ph.D. School of Economics and Public Policy Srinakharinwirot University Bangkok, THAILAND
Topics • Population Change : A Case of Thailand • Ageing Population: Celebration/Challenge? • Social Policy/Programs?
Population Change in Thailand Key Factors affecting population composition and population structure • Fertility (birth) • Mortality (death) • Migration
Population Change in Thailand 1. Thailand Population and the Rate of Increasing (Growth) • 1st half of 20th Century (1901-1940s): Thailand population has a slow rate population growth (1+%) • In the 1950s and 1960s: Rapid growth in population (about 3%) * HH survey from 1947-1959, 3.2% (17.4 Million- 26.4 Million)
Population Change in Thailand • Concerned Policy • Obstacles for country development • scarcity of resources • Income/earnings couldn’t catch up with development • Research for controlling numbers of population
Population Change in Thailand • Main Reasons for population growth in the 50s and 60s • Reduction in death rate due to a success in public health policy and medical advancement • Stimulating Policy for Pronatality toward East Asia leading country, e.g. choosing to invest in the form of children
Population Change in Thailand Policy Toward decreasing in birth rate and Fertility • 1969 began the Birth Control Campaign • 1977 had successful in evident of slower number birth rate • Now: very low increasing rate of population
Population Change in Thailand 2. Demographic Transition 2.1
Population Change in Thailand 2.2 Early Expanding Period • 1947-1977 • Dramatically decline in death rate • High rate of birth expectancy • Resulting to the present population (35-65 years old) • The group going to be in their retirement soon (some are) • The next group/ generation has a decreasing in numbers continuously
Population Change in Thailand 2.3 No Returning to the High Stationary • Complete Transition! • Affect labor market, welfare, and other infrastructures
Population Change in Thailand 3. Age Structure • demographic transition is dynamic • 1947 the beginning of transition 1980 the middle of transition where birth rate has decline significantly 2000 the end of the high stationary period What’s next???
Population Change in Thailand • Summary • Youth group has declined both in number and growth rate • The peak age group around 25-65 has increased both in number and growth rate • Thai people tend to live longer (decreasing of death rate) • We are now facing “Ageing Population,” or “Aging Society!”
Population Change in Thailand Population Pyramid
Population Change in Thailand 3. Urbanization and Urban Growth • Weak Explanation in terms of urbanization index • In Thailand, urban means “within municipality” • Reports show increasing number of people moving in to municipalities every year
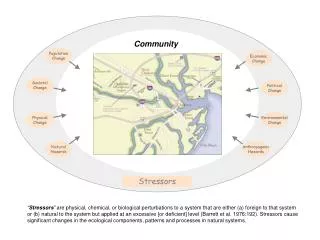
Back Effect to Country’s Economy Productivity Business/Industry Regional Economy Public Policy toward Aging Society Population Change Community Household Government Spending Consumption & Savings Investment International Trade
Population Ageing: A Celebration and a Challenge • Ageing is a triumph of development. People are living longer because of better nutrition, sanitation, medical advances, health care, education and economic well-being. • Although population ageing poses social and economic challenges to individuals, families and societies, with the right policies in place, societies can prepare for an ageing world, address the challenges and take advantage of the opportunities.
Ageing Population Around The world UNFPA (2012)
Ageing society Source: UN Population Division (2012)
Did you know ??? UNFPA (2012)
Did you know ??? UNFPA (2012)
Income Supporting Program • Developed Nation has some forms of universal income support for their elderly population • The differences in the structure of income support programs among countries for example: - Canada 3 programs : Universal Demo grant at age 65, Earning related pension at age 60, and mean-tested transfer at age 60 - Italy = 35 years of Labor market Experience ( Started work 20 , Retries 55 get full Benefit)
Health Insurance • Health care is a universal entitlement. ( The elderly do not receive particularly special care) • Only Japan , Separate system of health care for elderly • Developed countries use a variety of mechanisms to attempt to control medical cost
Non-Health In Kind Transfer Program • Residential Care • Home-help services • Rehabilitation service. • Housing Benefit • Food • Subsidized public transport
Government & Social Security "If men were angels, no government would be necessary.” James Madison Federalist Paper No. 51 1788
Transitional Analysis of Social Security-related Expenditure and National Burden Ratio in Major Advanced Countries In advanced countries, - Especially in Japan, social security expenditure is increasing due to aging. - As a consequence, burden is generally rising in these economies, though it has declined in Japan. ※National Burden Ratio = Total Taxes as a percentage of National Income (NI) + Social Security Contribution as a percentage of NI (Unit: %) Government Social Security-related Expenditures to GDP France Germany United Kingdom National Burden to GDP (Source) Social Security-related Expenditures: IMF “Government Finance Statistics Yearbook 2002”, OECD “Economic Outlook 76” , “Stat Extracts” and “National Accounts 2011 vol.II” National Burden Ratio: OECD “National Account 2011 vol.II” and “ Revenue Statistics”, CAO “National Accounts” etc. (Note )Figures represent the general government-based data (including the central/local governments and the social security funds). 37
Basic Concept of Social Security in Japan In Japan, social security is realized through burden sharing by “self-help”, “mutual help” and “public help”. Actually, “self-help” is a foundation of burden sharing, complemented by “mutual help” to share risks of life mutually, and then, “public help” is positioned to provide the necessary security for life against situations which are not to be covered by “self-help” and “mutual help”. 自助 Self-help The concept that people sustain their lives by working on their own and keep their good health on their own. Health insurance (1961 – ) The systems based on social insurance: insurance payment would be provided in case of disease, old-age, need in long-term care , or unemployment. Subscribers would make premium payment, while public expenses which secured by tax revenues would cover a part of resources of insurance payment. Pension insurance (1961 – ) 共助 Mutual help Long-term care insurance (2000 – ) Employment insurance (1974 – ) Worker’s accident compensation insurance (1974 – ) 公助 Public help The systems such as public assistance to ensure the healthy and cultured living of necessitous persons, as well as social welfare to provide a certain amount of goods and human services to the socially vulnerable. Public assistance (1950 – ) Measures for the disabled, etc. 38
Current Fiscal Situation (Contd.) Aging Population ● Japanese Life Expectancy ● Ratio of People Older than 65 years to the Total Population Japan Germany France U.K. U.S. (CY) (Source) “Abridged Life Tables 2010” (Ministry of Health, Labour and Welfare) (July, 2011) (Source) Japan 1950-2010: “National Census” (Ministry of Internal Affairs and Communications) 2011-2050: “Japanese Future Demographic Projections” (National Institute of Population and Social Security Research) (January, 2012) Other countries: “World Population Prospects: the 2010 Revision” (United Nations) 39
Japanese Population Pyramid in 1950 Source: National Institute of Social Security and Population Problems ชาย หญิง
Population Pyramid in 1970–1990-2010Source: National Institute of Social Security and Population Problems
Projection: 2030-2050Source: National Institute of Social Security and Population Problems
Population aging will progress furthermore in the future, and then, our country will face the severe society where one elderly person is supported by only one young person. <2050> <1965> <2012> Making an environment to enable the elderly to work longer period. ^^ ^^ ^^ ^^ ^^ > < - - ; - - ; - - ; ^^ ^^ ^^ ^^ ^^ ^^ 1.2 people will support 1 person aged 65 or over (estimates) 2.4 people support 1 person aged 65 or over Efforts are needed to increase in people on the support side as much as possible through the social security reform. 9.1 people supported 1 person aged 65 or over ^ ^ 0 ^ ^ 0 Population (thousand) / Component ratio Assistance to child and child-raising Age 65 and over Age 20-64 Age 19 and under (Source) Ministry of Internal Affairs “National Census”, “Population Estimates” National Institute of Population and Social Security Research “Population Projection for Japan (middle fertility and mortality projection)” 43
Comparison of General Account Budget between FY1990 and FY2013 Non-tax revenues Construction bonds ・ Most of expenditure increase is due to the growth of social security-related expenditure. ・ Increase of government bond issuance is due to the growth of social security-related expenditure as well as falling tax revenues. 2.6 Tax revenues 58.0 5.6 (Unit: trillion yen) Local allocation tax grants 15.3 Social security 11.6 (17.5%) Others 25.1 National debt Service 14.3 National debt service 22.2 Local allocation tax grants 16.4 Others 24.9 Social security 29.1 (31.4%) 2.6 Tax revenues 43.1 5.8 4.1 Special deficit-financing bonds 37.1 Construction bonds Non-tax revenues Pension related Special deficit-financing bonds 44 (Note) Data is based on Initial budget
Pension System in Japan Minimum: $670/month
Long Term Care Insurance System • Mandatory for people at the age of 40 • Minimum payment is around $ 41 (Depend on residents and individual economic status)
Social Security Benefits Expenditure Source: Japan Statistical Yearbook 2009
Ageing society in Thailand Challenge! :This issue leads to big concern for Thai government about “the financial stability” of public finance to “provide social security services”.
The extrapolationof changes in Thai population divided by ages.
Potential support ratio for old age in Thailand in 1960 – 2035.
Reforming the social security in Thailand to cope with aging society