Download

1 / 20
200 likes | 358 Views
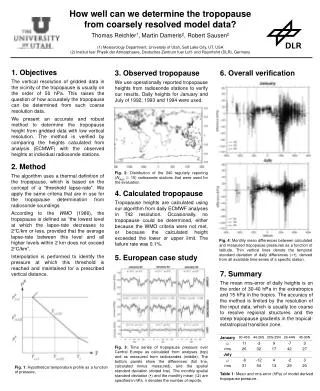
A New Tropopause Definition for Use in Chemistry-Transport Models. Jessica L. Neu, Michael J. Prather, Xin Zhu. Logan, 1999. Heggelin et al., 2009. Chemistry-transport models are tools that can help us understand what drives the chemical composition and variability of the UTLS.

E N D
A New Tropopause Definition for Use in Chemistry-Transport Models Jessica L. Neu, Michael J. Prather, Xin Zhu
Logan, 1999 Heggelin et al., 2009 Chemistry-transport models are tools that can help us understand what drives the chemical composition and variability of the UTLS
However, it is difficult to compare coarse-resolution models to high-resolution data, and standard tropopause definitions can be problematic Considine, et al. 2008
Thermal Tropopause: Works well in the tropics, but not the extratropics 1-D, poor spatial structure Most models can not resolve the observed sharpness of the lapse rate Dynamical Tropopause: Works well in the extratropics, is often replaced by potential T in the tropics Requires horizontal and vertical derivatives, which can be noisy in coarse-resolution models Ozone Tropopause: Is easy to define, and works well for many situations Can not diagnose what drives large observed variations at the tropopause
There are large inter-model differences in UTLS O3, and it is important for radiative forcing TES Ozone, Aug 2006 Adetutu Agedho,paper in prep AM2-Chem CAM-CHEM ECHAM5-MOZ GISS-PUCCINI
UCI CTM now uses ‘E90’ tracer to define tropopause • Uniform surface emissions, 90-day e-fold everywhere. • Global mean mixing ratio = 100 ppb • Define the tropopause mixing ratio such that the tropopsphere contains 83% of the mass of the atmosphere on average(from climatology) • E90: • -Identifies tropopause as a mixing barrier • -Is 3-D and instantaneous • -Does not require calculating derivatives • -Has a single definition in tropics and extratropics • E90 Allows us to: • compare with tropopause observations • understand seasonality of O3 at the tropopause. • Diagnose mixing vs chemistry
UCI CTM T42 L40 ECMWF IFS forecast fields Instantaneous E90 at Lon=180, 0Z April 1, 2000 Corresponding O3 mixing ratios White = E90 Tropopause (110 ppb) Black = O3 Tropopause (110 ppb) Red = PV Tropopause (2 PVU) Orange = Thermal Tropopause (2 K/km)
Zonal Mean Structure, Instantaneous Tropopause Pressures The E90 tropopause is highly correlated with the dynamical tropopause (2 PVU) There are large differences between E90 and O3 in the Southern Hemisphere The Thermal tropopause is higher than E90 and the dynamical tropopause in the extratropics, and lower in the tropics Zonal Mean O3, 0Z 1 Apr 2000
E90 vs Thermal Tropopause: Preserving Gradients in Relative-to-Troposphere Coordinates Thermal Trop E90 E90 and the Thermal Tropopause both preserve gradients in RTT coordinates in the tropics, but the thermal tropopause is lower than E90.
E90 vs Thermal Tropopause: Preserving Gradients in Relative-to-Troposphere Coordinates Thermal Trop E90 E90 produces sharper gradients and a narrower distribution in the Extratropics. The thermal tropopause is significantly higher than the E90 tropopause
UCI CTM vs Ozonesondes: Preserving Gradients in Relative-to-Troposphere Coordinates Logan, JGR 1999 UCI CTM
Variability: The monthly mean tropopause is not the same as the tropopause determined by the monthly mean E90 The mean of daily tropopause pressures has a great deal of structure
The monthly mean of daily tropopause O3 has much higher values and larger variability than the O3 at the monthly mean tropopause
Seasonal Variability – UCI CTM vs Ozonesondes Variability is good, but O3 values are a bit high, especially in the upper troposphere E90 varies by only ~1% near the tropopause Logan, JGR 1999 UCI CTM
Variability: Seasonal Variability of Tropopause Pressure E90 produces very realistic tropopause pressures Considine et al, ACP 2008
Variability: Seasonal Variability of Tropopause O3 UCI CTM with E90 tropopause reproduces observed variability except in the tropics Considine et al, ACP 2008
What is happening in the tropics? Considine et al, ACP 2008
The U. Oslo ECMWF IFS Met Fields that we are using have an error in the tropical stratospheric circulation in the 40-Layer version. The 60-Layer IFS fields do not have this error, and we are checking whether this contributes to our poor ozone simulation near the tropical tropopause
Summary • E90 provides an instantaneous, simple definition of the tropopause with fine spatial structure • It preserves strong cross-tropopause gradients in tracers in RTT coordinates and should produce compact tracer-tracer correlations • The UCI CTM with E90 captures the observed variability in tropopause pressure and O3, with some problems in the tropics • E90 will allow us to diagnose the relative contributions of chemistry and mixing to UTLS ozone variability
Why does O3 vary seasonally at the tropopause? It is not an STE issue since that would affect e90 tracer – e90 varies by only ~1% Likely it reflects peak summertime O3 production in the sub-tropical lower stratosphere from O2 photolysis Perhaps it is increased downward B-D circulation (check age-of-air)