Download
1 / 1
10 likes | 116 Views
The multivariate SAM2V1 scheme. Assimilated data.

E N D
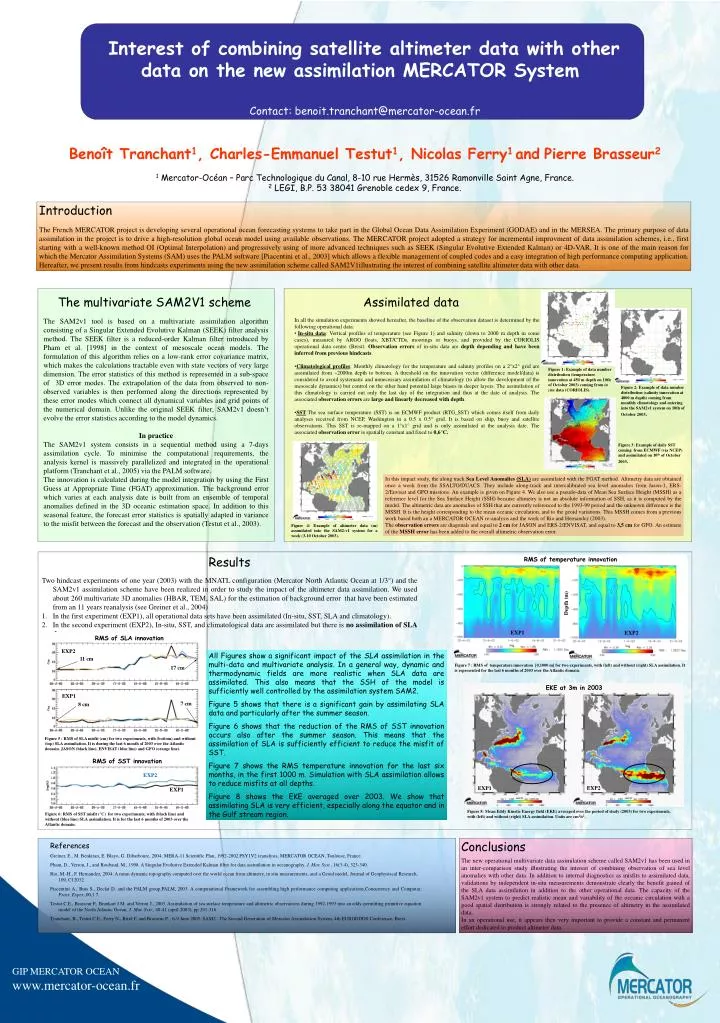
The multivariate SAM2V1 scheme Assimilated data The SAM2v1 tool is based on a multivariate assimilation algorithm consisting of a Singular Extended Evolutive Kalman (SEEK) filter analysis method. The SEEK filter is a reduced-order Kalman filter introduced by Pham et al. [1998] in the context of mesoscale ocean models. The formulation of this algorithm relies on a low-rank error covariance matrix, which makes the calculations tractable even with state vectors of very large dimension. The error statistics of this method is represented in a sub-space of 3D error modes. The extrapolation of the data from observed to non-observed variables is then performed along the directions represented by these error modeswhich connect all dynamical variables and grid points of the numerical domain.Unlike the original SEEK filter, SAM2v1 doesn’t evolve the error statistics according to the model dynamics. In practice The SAM2v1 system consists in a sequential method using a 7-days assimilation cycle. To minimise the computational requirements, the analysis kernel is massively parallelized and integrated in the operational platform (Tranchant et al., 2005) via the PALM software. The innovation is calculated during the model integration by using the First Guess at Appropriate Time (FGAT) approximation. The background error which varies at each analysis date is built from an ensemble of temporal anomalies defined in the 3D oceanic estimation space. In addition to this seasonal feature, the forecast error statistics is spatially adapted in variance to the misfit between the forecast and the observation (Testut et al., 2003). • In all the simulation experiments showed hereafter, the baseline of the observation dataset is determined by the following operational data: • In-situ data: Vertical profiles of temperature (see Figure 1) and salinity (down to 2000 m depth in some cases), measured by ARGO floats, XBT/CTDs, moorings or buoys, and provided by the CORIOLIS operational data centre (Brest). Observation errors of in-situ data are depth depending and have been inferred from previous hindcasts. • Climatological profiles: Monthly climatology for the temperature and salinity profiles on a 2°x2° grid are assimilated from ~2000m depth to bottom. A threshold on the innovation vector (difference model/data) is considered to avoid systematic and unnecessary assimilation of climatology (to allow the development of the mesoscale dynamics) but control on the other hand potential large biases in deeper layers. The assimilation of this climatology is carried out only the last day of the integration and thus at the date of analysis. The associated observation errors are large and linearly decreased with depth. • SST:The sea surface temperature (SST) is an ECMWF product (RTG_SST) which comes itself from daily analyses received from NCEP, Washington in a 0.5 x 0.5° grid. It is based on ship, buoy and satellite observations. This SST is re-mapped on a 1°x1° grid and is only assimilated at the analysis date. The associated observation error is spatially constant and fixed to 0,6°C. Figure 1: Example of data number distribution (temperature innovation at 450 mdepthon 10th of October 2003) coming from in situ data (CORIOLIS). Figure 2: Example of data number distribution (salinity innovation at 4800 m depth) coming from monthly climatology and entering into the SAM2v1 system on 10th of October 2003. Figure 3: Example of daily SST coming from ECMWF (via NCEP) and assimilated on 10th of October 2003. In this impact study,the along track Sea Level Anomalies(SLA) are assimilated with the FGAT method. Altimetry data are obtained once a week from the SSALTO/DUACS. They include along-track and intercalibrated sea level anomalies from Jason-1, ERS-2/Envisat and GFO missions. An example is given on Figure 4. We also use a pseudo-data of Mean Sea Surface Height (MSSH) as a reference level for the Sea Surface Height (SSH) because altimetry is not an absolute information of SSH, as it is computed by the model. The altimetric data are anomalies of SSH that are currently referenced to the 1993-99 period and the unknown difference is the MSSH. It is the height corresponding to the mean oceanic circulation, and to the geoid variations. This MSSH comes from a previous work based both an a MERCATOR OCEAN re-analysis and the work of Rio and Hernandez (2003). The observation errors are diagonals and equal to 2 cm for JASON and ERS-2/ENVISAT, and equal to 3,5 cm for GFO. An estimate of the MSSH error has been added to the overall altimetric observation error. Figure 4: Example of altimeter data (m) assimilated into the SAM2-v1 system for a week (3-10 October 2003). RMS of temperature innovation Results Two hindcast experiments of one year (2003) with the MNATL configuration (Mercator North Atlantic Ocean at 1/3°) and the SAM2v1 assimilation schemehave been realized in order to study the impact of the altimeter data assimilation. We used about 260 multivariate 3D anomalies (HBAR, TEM, SAL) for the estimation of background error that have been estimated from an 11 years reanalysis (see Greiner et al., 2004) In the first experiment (EXP1), all operational data sets have been assimilated (In-situ, SST, SLA and climatology). In the second experiment (EXP2), In-situ, SST, and climatological data are assimilated but there is no assimilation of SLA data. Depth (m) EXP1 EXP2 RMS of SLA innovation EXP2 11 cm Figure 7 : RMS of temperature innovation [0,1000 m] for two experiments, with (left) and without (right) SLA assimilation. It is represented for the last 6 months of 2003 over the Atlantic domain. 17 cm All Figures show a significant impact of the SLA assimilation in the multi-data and multivariate analysis. In a general way, dynamic and thermodynamic fields are more realistic when SLA data are assimilated. This also means that the SSH of the model is sufficiently well controlled by the assimilation system SAM2. Figure 5 shows that there is a significant gain by assimilating SLA data and particularly after the summer season. Figure 6 shows that the reduction of the RMS of SST innovation occurs also after the summer season. This means that the assimilation of SLA is sufficiently efficient to reduce the misfit of SST. Figure 7 shows the RMS temperature innovation for the last six months, in the first 1000 m. Simulation with SLA assimilation allows to reduce misfits at all depths. Figure 8 shows the EKE averaged over 2003. We show that assimilating SLA is very efficient, especially along the equator and in the Gulf stream region. EKE at 3m in 2003 EXP1 7 cm 8 cm Figure 5 : RMS of SLA misfit (cm) for two experiments, with (bottom) and without (top) SLA assimilation. It is during the last 6 month of 2003 over the Atlantic domain. JASON (black line), ENVISAT (blue line) and GFO (orange line). RMS of SST innovation EXP2 EXP1 Figure 8: Mean Eddy Kinetic Energy field (EKE) averaged over the period of study (2003) for two experiments, with (left) and without (right) SLA assimilation. Units are cm2/s2. Figure 6: RMS of SST misfit (°C) for two experiments, with (black line) and without (blue line) SLA assimilation. It is for the last 6 months of 2003 over the Atlantic domain. EXP2 EXP1 Conclusions The new operational multivariate data assimilation scheme called SAM2v1 has been used in an inter-comparison study illustrating the interest of combining observation of sea level anomalies with other data. In addition to internal diagnostics as misfits to assimilated data, validations by independent in-situ measurements demonstrate clearly the benefit gained of the SLA data assimilation in addition to the other operational data. The capacity of the SAM2v1 system to predict realistic mean and variability of the oceanic circulation with a good spatial distribution is strongly related to the presence of altimetry in the assimilated data. In an operational use, it appears then very important to provide a constant and permanent effort dedicated to product altimeter data. References Greiner, E., M. Benkiran, E. Blayo, G. Dibarboure, 2004: MERA-11 Scientific Plan, 1992-2002 PSY1V2 reanalysis, MERCATOR OCEAN, Toulouse, France. Pham, D., Verron, J., and Roubaud, M., 1998. A Singular Evolutive Extended Kalman filter for data assimilation in oceanography. J. Mar. Syst., 16(3-4), 323-340. Rio, M.-H., F. Hernandez, 2004: A mean dynamic topography computed over the world ocean from altimetry, in situ measurements, and a Geoid model, Journal of Geophysiscal Research, 109, C12032. Piacentini A., Buis S., Declat D. and the PALM group,PALM, 2003. A computational Framework for assembling high performance computing applications,Concurrency and Computat.: Pract. Exper.,00,1 7. Testut C.E., Brasseur P., Brankart J.M. and Verron J., 2003. Assimilation of sea surface temperature and altimetric observations during 1992-1993 into an eddy-permitting primitive equation model of the North Atlantic Ocean, J. Mar. Syst., 40-41 (april 2003), pp 291-316. Tranchant, B., Testut C.E., Ferry N., Birol F. and Brasseur P. , 6-9 June 2005. SAM2 : The Second Generation of Mercator Assimilation System, 4th EUROGOOS Conference, Brest. GIP MERCATOR OCEAN www.mercator-ocean.fr Interest of combining satellite altimeter data with other data on the new assimilation MERCATOR System Contact: benoit.tranchant@mercator-ocean.fr Benoît Tranchant1, Charles-Emmanuel Testut1, Nicolas Ferry1andPierre Brasseur2 1 Mercator-Océan – Parc Technologique du Canal, 8-10 rue Hermès, 31526 Ramonville Saint Agne, France. 2 LEGI, B.P. 53 38041 Grenoble cedex 9, France. Introduction The French MERCATOR project is developing several operational ocean forecasting systems to take part in the Global Ocean Data Assimilation Experiment (GODAE) and in the MERSEA. The primary purpose of data assimilation in the project is to drive a high-resolution global ocean model using available observations. The MERCATOR project adopted a strategy for incremental improvment of data assimilation schemes, i.e., first starting with a well-known method OI (Optimal Interpolation) and progressively using of more advanced techniques such as SEEK (Singular Evolutive Extended Kalman) or 4D-VAR. It is one of the main reason for which the Mercator Assimilation Systems (SAM) uses the PALM software [Piacentini et al., 2003] which allows a flexible management of coupled codes and a easy integration of high performance computing application. Hereafter, we present results from hindcasts experiments using the new assimilation scheme called SAM2V1illustrating the interest of combining satellite altimeter data with other data.