Download
1 / 30
450 likes | 948 Views
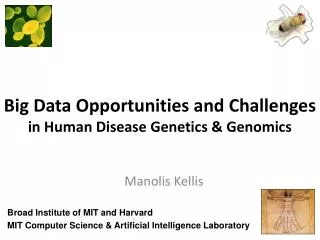
Epigenomic and regulatory genomics of complex human disease. Manolis Kellis. Broad Institute of MIT and Harvard. MIT Computer Science & Artificial Intelligence Laboratory. Personal genomics today: 23 and Me. Recombination breakpoints. Family Inheritance. Me vs. my brother. My dad.

E N D
Epigenomic and regulatory genomics of complex human disease Manolis Kellis Broad Institute of MIT and Harvard MIT Computer Science & Artificial Intelligence Laboratory
Personal genomics today: 23 and Me Recombination breakpoints Family Inheritance Me vs. my brother My dad Mom’s dad Dad’s mom Human ancestry Disease risk AMD Risk Genomics: Regions mechanisms drugs Systems: genes combinations pathways
Genetic Variant Tissue/ cell type Molecular Phenotypes Organismal phenotypes Gene Expression Changes EpigeneticChanges Methyl. DNA access. Enhancer H3K27ac Promoter Insulator Geneexpr. Heart Endophenotypes Muscle Lipids Tension Heartrate Metabol. Drug resp CATGACTG Cortex CATGCCTG Geneexpr. Disease Lung Blood Skin Geneexpr. Nerve Environment Feedback from environment / disease state
1 2 3 1 2 3 Regulatory andsystems genomics Apply to complex disease Interpret GWAS Chromatin states Epigenomics in patients Enhancer linking Causal Regulators Disease Networks
Epigenomics Roadmap across 100+ tissues/cell types • Diverse epigenomic assays: • 1. Histone modifications • H3K4me3, H3K4me1 • H3K36me3 • H3K27me3, H3K9me3 • H3K27ac, H3K9ac • 2. Open chromatin: • DNase • 3. DNA methylation: • WGBS, RRBS, MRE/MeDIP • 4. Gene expression • RNA-seq, Exon Arrays Art: Rae Senarighi, Richard Sandstrom Diverse tissues and cells: Adult tissues and cells (brain, muscle, heart, digestive, skin, adipose, lung, blood…) Fetal tissues (brain, skeletal muscle, heart, digestive, lung, cord blood…) ES cells, iPS, differentiated cells (meso/endo/ectoderm, neural, mesench, trophobl)
Diverse chromatin signatures encode epigenomic state • 100s of known modifications, many new still emerging • Systematic mapping using ChIP-, Bisulfite-, DNase-Seq Enhancers Promoters Transcribed Repressed • H3K4me1 • H3K27ac • DNase • H3K4me3 • H3K9ac • DNase • H3K36me3 • H3K79me2 • H4K20me1 • H3K9me3 • H3K27me3 • DNAmethyl • H3K4me3 • H3K4me1 • H3K27ac • H3K36me3 • H4K20me1 • H3K27me3 • H3K9me3 • H3K9ac
Deep sampling of 9 reference epigenomes (e.g. IMR90) UWash Epigenome Browser, Ting Wang Chromatin state+RNA+DNAse+28 histone marks+WGBS+Hi-C
Chromatin states capture combinations and dynamics • Single annotation track for each cell type • Capture combinations of histone marks • Summarize cell-type activity at a glance • Study activity pattern across cell types Predicted linking Correlatedactivity
Chromatin state annotations across 127 epigenomes Reveal epigenomic variability: enh/prom/tx/repr/het AnshulKundaje
2.3M enhancer regions only ~200 activity patterns immune dev/morph muscle morph learning kidney <3 smoothmuscle liver WouterMeuleman
Systematic motif dissection in 2000 enhancers: 5 activators and 2 repressors in 2 cell lines 54000+ measurements (x2 cells, 2x repl) Kheradpouret alGenome Research 2013
Example activator: conserved HNF4 motif match WT expression specific to HepG2 Motif match disruptions reduce expression to background Non-disruptive changes maintain expression Random changes depend on effect to motif match
1 2 3 1 2 3 Regulatory andsystems genomics Apply to complex disease Interpret GWAS Chromatin states Epigenomics in patients Enhancer linking Causal Regulators Disease Networks
The challenge of interpreting disease-association studies • Large associated blocks with many variants: Fine-mapping challenge • No information on cell type/mechanism, most variants non-coding • Epigenomic annotations help find relevant cell types / nucleotides
xx Revisiting disease- associated variants • Disease-associated SNPs enriched for enhancers in relevant cell types • E.g. lupus SNP in GM enhancer disrupts Ets1 predicted activator
Mechanistic predictions for top disease-associated SNPs Lupus erythromatosus in GM lymphoblastoid Erythrocyte phenotypes in K562 leukemia cells Disrupt activator Ets-1 motif Loss of GM-specific activation Loss of enhancer function Loss of HLA-DRB1 expression ` Creation of repressor Gfi1 motif Gain K562-specific repression Loss of enhancer function Loss of CCDC162 expression
GWAS hits in enhancers of relevant cell types Immune traits, heart, height, platelets, in relevant tissues Luke Ward
Rank-based functional testing of weak associations Enrichment peaks at 10,000s of SNPsdown the rank list, even after LD pruning! Abhishek Sarkar • Rank all SNPs based on GWAS signal strength • Functional enrichment for cell types and states
Weak-effect T1D hits in 1000s T-cell enhancers enhancers CD4+ T-cells • Enhancer enrichment strong for top ~30k SNPs • Heritability estimates also increase until ~30k SNPs T-cells B-cells Other cell types Abhishek Sarkar
Brain methylation changes in AD patients Enhancers • 10,000s of methylation differences in AD vs. control • Harbor 1000s of genetic variants associated with AD • Localized in brain-specific enhancers and pathways Per state: (Obs – Exp) / Total Promoters
T1D/RA-enriched enhancers spread across genome • High concentration of loci in MHC, high overlap • Yet: many distinct regions, 1000s of distinct loci Abhishek Sarkar
Bayesian model for joining weak SNPs in pathways Inputs Outputs GWAS summary statistics (SNP P-values) SNP disease-relevance (yes/no) Physical distances between ncSNPsand TSS Gene target (if any) of each SNP3 Gene disease-relevance (yes/no) Interaction network Disease-relevant gene Gene near relevant SNP Disease-relevant SNP Legend Gerald Quon
Example 1: MAZ predicted role in T1D 1200 Poorly ranked SNP nearby Highly ranked SNP nearby # SNPs (p>0) 0 0 1 p(SNP relevant) 15k # genes 0 0 1 p(gene relevant) Gerald Quon • MAZ no direct assoc, but clusters w/ many T1D hits • MAZ indeed known regulator of insulin expression
Example 2: SP3 predicted role in MS 300 Poorly ranked SNP nearby Highly ranked SNP nearby # SNPs (p>0) 0 0 1 p(SNP relevant) 8k # genes 0 0 1 p(gene relevant) Gerald Quon • SP3 no direct assoc but clusters w/ many MS hits • SP3 is indeed down-regulated in MS patients
# non-genetic hits missing heritability • Missing heritability partly due to weak variants • Regulators lacking association harbor rare variantse.g. Coronary artery disease: GATA6 (congential heart disease), HNF1A (cardiovascular), PPARG (lipid metabolism, partial lipodystrophy) Gerald Quon
Validate weak variant targets in model organisms Use CRISPR/Cas to edit nucleotides, knockdown target genes Alzheimer:Differential activity in mouse neurodegeneration Cardiac: Repolarization interval in zebrafish heart Andreas Pfenning Xinchen Wang
1 2 3 1 2 3 Regulatory andsystems genomics Apply to complex disease Interpret GWAS Chromatin states Epigenomics in patients Enhancer linking Causal Regulators Disease Networks
Integrative analysis of 100+ epigenomes • Reference Epigenomes chromatin states, linking • Annotate dynamic regulatory elements in multiple cell types • Activity-based linking of regulators enhancers targets • Interpreting disease-associated sequence variants • Mechanistic predictions for individual top-scoring SNPs • Functional roles of 1000s of disease-associated SNPs • Disease networks: links SNPsgenesphenotypes • Module-based linking of enhancers to their target genes • Bayesian model for evaluating disease genes and SNPs • Genetic / epigenomic variation in health and disease • Genetic variationBrainmethylationAlzheimer’sdisease • Global repression of distal enhancers. NRSF, ELK1, CTCF
MIT Computational Biology Group MIT Computational Biology Group HaydenMetsky Anshul Kundaje Andreas Pfenning Matt Eaton Luis Barrera Abhishek Sarkar Stefan Washietl Matt Rasmussen Bob Altshuler Manolis Kellis Pouya Kheradpour Mukul Bansal David Hendrix Manasi Vartak Jessica Wu Mariana Mendoza Wouter Meuleman Daniel Marbach Soheil Feizi Gerald Quon Jason Ernst Luke Ward
Roadmap Epigenomics Integrative Analysis Team AnshulKundaje WouterMeuleman Jason Ernst MishaBilenky Jianrong Wang Angela Yen Luke Ward AbhishekSarkar Gerald Quon PouyaKheradpour AlirezaHeravi-Moussavi Lisa Chadwick Ting Wang John Stam Bing Ren Martin Hirst Joe Costello Brad Bernstein AleksMilosavljevic CristianCoarfa, Alan Harris, Michael Ziller, Matthew Schultz, Matt Eaton, Andreas Pfenning, Xinchen Wang, Paz Polak, Rosa Karlic, VirenAmin, Yi-Chieh Wu, Richard S Sandstrom, Zhizhuo Zhang, GiNell Elliott, Rebecca Lowdon